
Louisiana has the highest per capita energy consumption of any state in the US, and among the lowest retail electricity prices, thanks largely to an abundance of gas-fired generation capacity and an extensive network of existing supply infrastructure.
But a key question for the state is what role gas-fired generation will continue to play in the medium to long-term. The need to curtail fugitive methane and greenhouse gas emissions along the value chain is intensifying, while decentralised renewable generation and energy storage are increasingly becoming cheaper and more competitive.
In this guest contribution, Dr. Tade Oyewunmi, an Assistant Professor at the Institute for Energy and the Environment, Vermont and Visiting Fellow at the Tulane Center for Energy Law, Louisiana, provides a detailed overview of Louisiana’s energy sector and the challenges faced by policy-makers in reducing emissions from this hydrocarbon-rich region.
Transitional energy markets are subject to competing interests. On the one hand, consumers want reliable and affordable energy and in a growing number of contexts to be able to make their energy production and reliability decisions, while producers want to be able to make reasonable returns on capital investments.
On the other hand, policymakers need to be able to find the most effective ways to balance these counteracting objectives while also ensuring that energy supply is carried out in the most environmentally sustainable manner.
For this reason, successful energy industry decarbonization requires a comprehensive and rational approach, rather than a lopsided or haphazard outlook on energy policy and regulation.
It is essential for policymakers, regulatory institutions, and stakeholders in the energy market to clearly understand the short, medium to long term implications of their choices.
These outcomes are influenced by factors such as availability and access to a particular energy supply source (for instance local gas reserves or scalable solar and wind energy resources), as well as the existing infrastructure to bring these resources to market in the most cost-efficient and sustainable manner.[i]
Additional considerations include (i) the cost of building new connecting or energy storage infrastructure to guarantee reliability and resilience in the renewable energy context,[ii] or (ii) the cost of existing or newly built pipelines as well as technologies deployed to detect and stop fugitive emissions from gas networks to capture, store and effectively utilize gas that would otherwise be emitted, or (iii) upgraded transmission lines and other facilities affect prices for the end-user.
States, countries or societies with less scalable energy resources, or resources that require substantial investments and new major infrastructure to deliver reliable, reasonably priced energy, may have to cope with issues such as increasing retail prices and reliability constraints.
Developing the nitty-gritty of energy policy is a complex challenge when considering the need for cleaner and more sustainable pathways. This is particularly true in countries or regions with:
- Substantial hydrocarbon resources, especially coal and natural gas,
- A robust network of ‘locked-in’ supply infrastructure such as pipelines and processing facilities,
- A relatively developed market system that hinges on informed consumer choices and affordable end-user (retail) energy prices.
Louisiana, for instance, is one of the top five natural gas-producing states in the US, accounting for 7% of U.S. total gas production and about 8% of the nation's gas reserves.[iii]
In 2016, Louisiana ranked as the state with the highest per capita total energy consumption in the US, mostly due to its large industrial sector, which includes its energy-intensive chemical, petroleum, and natural gas industries, and its modest population size.[iv]
The state has been a key participant in the booming gas-to-power industry that evolved in the US since the 1990s.[v] Thus, half of the ten largest power plants currently in Louisiana (based on generation, not capacity) are gas-fired.[vi]
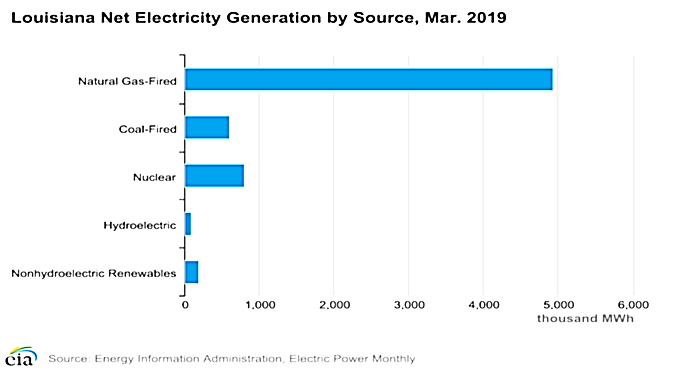
In 2018, Louisiana’s net electricity generation by fuel source comprised of gas (61.0%), nuclear (16.9%), coal (11.6%), and non-hydro renewables (2.7%). Figure 1 below also confirms the same trend with natural gas serving as the major source for generating electricity in Louisiana.
Figure 1: Net Electricity Generation by Source in Louisiana for March 2019[vii]
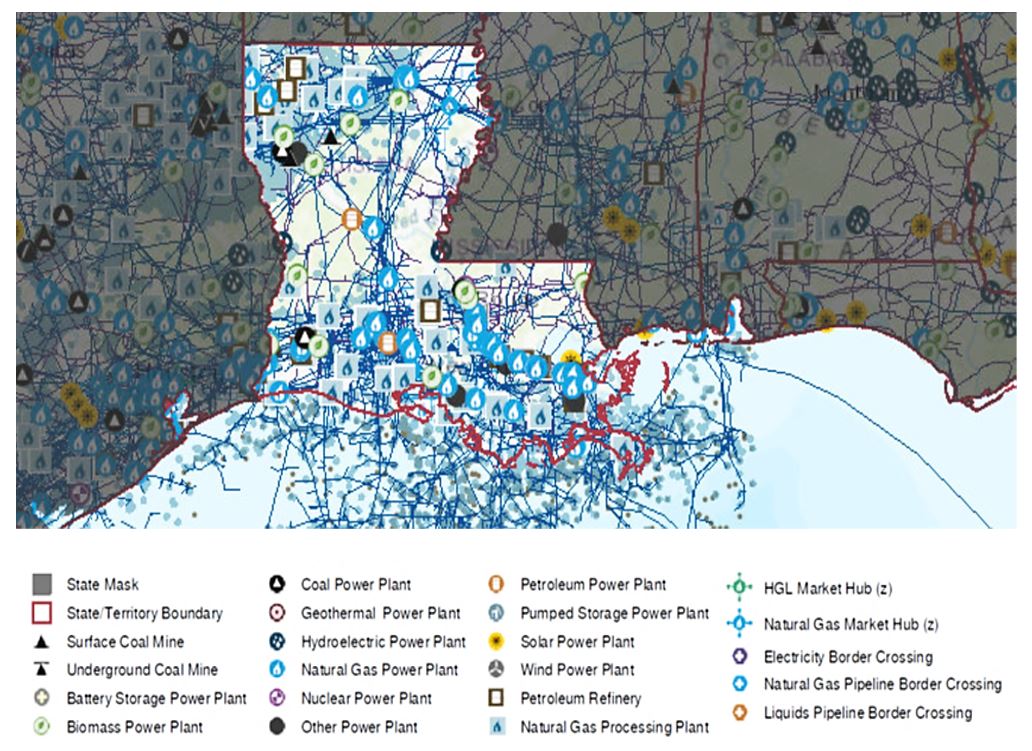
Among other things, figure 2 below shows the current energy supply and infrastructure map for Louisiana, including elements such as coal-fired plants, petroleum fired-plants, very little solar, gas pipelines networks and processing facilities, biomass-power plants, etc.
Figure 2: US EIA- Louisiana Energy Supply and Infrastructure Map (as of February 21, 2019)
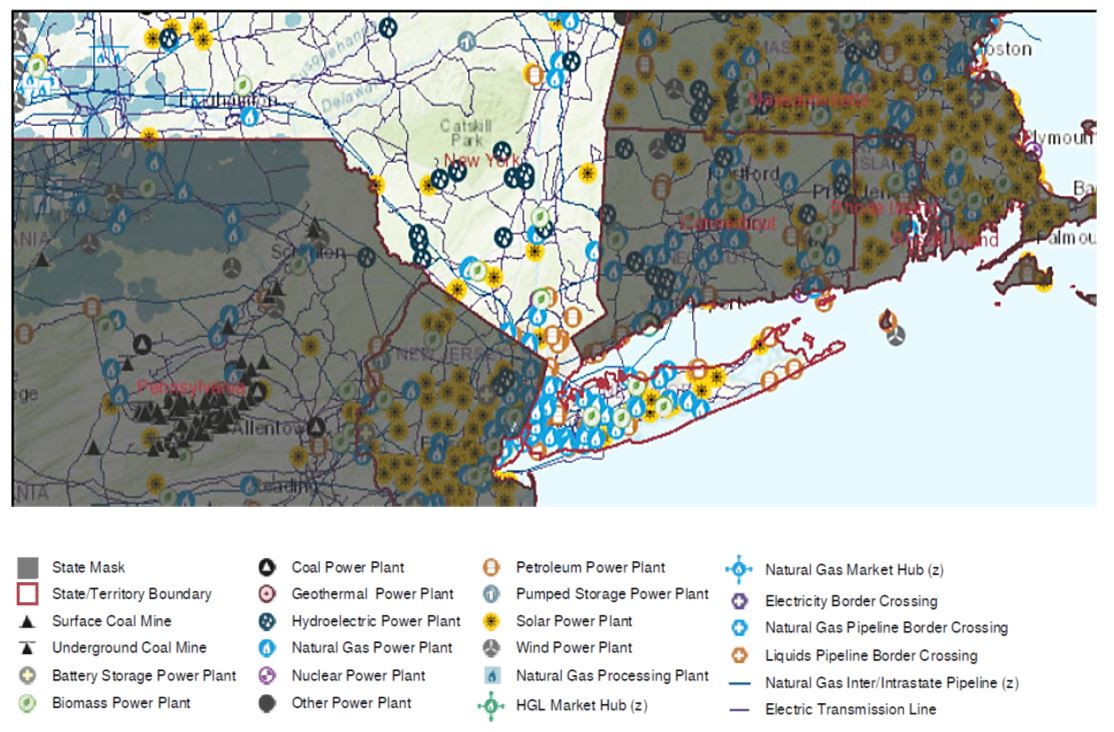
 Despite the decreasing costs of producing electricity from solar and wind in the US and globally, and increasing utilization of such ‘clean energy’ sources in states such as New York (see figure 3) and Texas, Louisiana still records the lowest Average Retail Price of Electricity to Residential Sector (cents/kWh) in the US, at $9.29. This price reflects significant reliance on cheaper natural gas and the vibrant gas supply market that is backed by the existence of a robust network of supply pipelines and infrastructure, less nuclear and decreasing coal utilization.[viii]
Generally, the actual costs of production and supply, and the approach to economic regulation by the relevant state or region affects retail prices. Although a state like New York has a considerable fleet of gas-to-power and hydro in its energy mix, the growing role of renewables and the availability of government-backed credits and support creates an intriguing context to understand the trade-offs and costs attributable to power sector decarbonization going-forward
During the transition, regulators and grid operators will need to maintain competitiveness, ensure grid resilience and reliability, minimize social and economic costs, and prevent stranded assets and stranded contractual commitment issues.
Figure 3: US EIA- New York Energy Supply and Infrastructure Map (as at February 2019)
Supplying Energy in Louisiana
Electric utilities in Louisiana operate in a regulated market environment.[ix] There are three principal investor-owned utilities with state-mandated distribution areas – Entergy Corp. (with responsibility split between Entergy Louisiana[x] and Entergy New Orleans), Cleco Power, and Southwestern Electric Power Company (SWEPCO).
Additional areas are served by smaller electric cooperatives, and the state also has a large number of cogeneration facilities because of the many industrial plants that produce their electricity through combined heat and power.[xi]
These facilities appear to rely mainly on natural gas for their electricity generation.[xii] Entergy is the largest utility generator in Louisiana, with about 9,440 megawatts (MW) of regulated power plant capacity in the state, compared to Cleco’s 3,310 and SWEPCO’s 1,143.[xiii]
Louisiana’s Regulated Market Structure
The Louisiana Public Service Commission (PSC) is the principal market regulator in the state, with responsibility for ensuring that safe, reliable, and reasonably priced services are provided by public utilities and motor carriers.[xiv]
The PSC has the power to regulate the rates of the state’s investor-owned utilities (IOUs) but not of the electric cooperatives, unless a cooperative’s membership votes to have its service rates regulated by the PSC rather than by the cooperative’s Board of Directors.[xv] Municipally-owned electric utilities can also be exempt from PSC regulation.[xvi]
The rate-making process is as follows: a utility proposes a revenue level that (a) covers its reasonable operating expenses (typically including fuel costs, e.g., gas or coal or solar power) and (b) provides a reasonable rate of return on its capital investments. The PSC (or another regulatory body) then determines whether this rate is “just and reasonable.”[xvii]
Importantly, the Louisiana PSC does not have any authority in areas regulated by the Federal Energy Regulatory Commission (FERC) - notably, interstate wholesale electric rates and certain cost allocations made by multi-state utilities and approved in FERC tariff schedules.[xviii]
Except for SWEPCO’s territory in northwest Louisiana, transmission services in the state are operated by the Midcontinent Independent System Operator (MISO), a regional transmission organization under FERC Order No. 2000.[xix]
Natural Gas versus Renewables: Price Comparisons
The following section deals with Louisiana’s largest electric utility, Entergy, but the same concepts also apply to other investor-owned utilities.
Entergy meets the demand of its retail customers through its own electricity generation assets and power purchases from MISO’s energy markets – i.e., purchases of excess power from other utilities as well as power from independent power producers (IPPs).
As required by La. PSC rules, Entergy forecasts its future load requirements and proposes its plans to meet the future electric load in its Integrated Resource Plan (IRP).[xx] Entergy’s IRP reveals that all of its future major resource additions will be natural gas-fired power: 1,847 MW of natural gas Combined Cycle Gas Turbines (CCGT) and 363 MW of natural gas simple cycle combustion turbine (CT).[xxi]
This can be interpreted in the context of Louisiana considering the existence of a robust network of gas pipelines and processing facilities as well as onshore and offshore gas resources, the comparative price advantages of gas being cheaper than coal following the continued shale gas production boom in the US.
At this point in time, it is uncertain to what extent pro-sustainability rules and mandates such as the Obama-era Clean Power Plan (CPP) or the methane emissions and monitoring regulations issued by the Environmental Protection Agency (EPA)[xxii] (now being rolled back by the Trump administration)[xxiii] would have had on the costs of gas and coal as fuel for power generation or investment decisions on gas-fired generation compared to utility-scale renewables.
The issued Regulatory Impact Analysis for the final Affordable Clean Energy Rule and Repeal of the Clean Power Plan may serve as a pointer to resolving or debating such contentions.[xxiv]
Under a 2016 Request for Proposals, Entergy solicited 200 MW of renewable resources, and on February 2019, the Louisiana PSC approved a Power Purchase Agreement (PPA) whereby Entergy will purchase 50 MW of solar power from a solar photovoltaic facility being constructed by Eagle Solar Group.[xxv]
According to the U.S. EIA, the average cost of natural gas delivered for electricity generation in Louisiana was $3.31 per million British Thermal Units (MMBtu). This represented a slight (1.2%) increase over the average price of $3.27/MMBtu in 2017.[xxvi]
The EIA data suggests that 19 other states had prices for natural gas used for electricity generation lower than Louisiana. Nevertheless, during 2017, Louisiana had the lowest average retail price of electricity in the US at 7.79 cents/kWh.[xxvii]
Entergy Louisiana, who mainly rely on generation from natural gas and nuclear and has only 180 MW from renewables, have retail prices “at or near the lowest within the State.”[xxviii]
It is rare to find publicly available information on the exact costs for electricity generation from different fuel sources, although the EIA projects the anticipated costs of new electricity generation in its Annual Energy Outlook report.
It calculates the Levelized cost of electricity (LCOE), which “represents the average revenue per unit of electricity generated that would be required to recover the costs of building and operating a generating plant during an assumed financial life and duty cycle.”[xxix]
Thus, LCOE reflects ongoing operating expenses – such as fuel costs – as well as capital expenditure and financing. The electric industry often cites LCOE “as a convenient summary measure of the overall competitiveness of different generating technologies.”[xxx]
The following table reproduces the LCOE for natural gas and renewable generation technologies entering into service in 2023.
| Estimated LCOE for new generation resources entering service in 2023 (2018 $/MWh) | |||||
| Plant type | Capacity factor (%) | Total system LCOE | Levelized tax credit | Total LCOE incl. tax credit | |
| Natural Gas | Conventional CCGT | 87 | 46.3 | N/A | 46.3 |
| Advanced CCGT | 87 | 41.2 | N/A | 41.2 | |
| Conventional CT | 30 | 89.3 | N/A | 89.3 | |
| Advanced CT | 30 | 77.7 | N/A | 77.7 | |
| Renewables | Wind, onshore | 41 | 55.9 | -6.1 | 49.8 |
| Wind, offshore | 45 | 130.4 | -12.9 | 117.5 | |
| Solar PV | 29 | 60 | -14.3 | 45.7 | |
| Solar thermal | 25 | 157.1 | -35.9 | 121.2 | |
Therefore, even taking into consideration technological improvements that make renewables more cost-competitive in the future, natural gas CCGT will, all things being equal, remain the most cost-efficient form of electricity generation in the short to medium-term for a state like Louisiana. Some of the factors supporting the cost-competitiveness of gas-to-power in the state arguably include electricity market design, the vibrant gas market, and the network of infrastructure already in place.
However, over its lifetime, solar PV is cheaper than conventional CCGT, at least for the remaining tenure of the solar production tax credit (PTC).
These numbers also underscore the importance of federal tax credits for renewable energy developments in the near future, even as the costs for renewables generation continue to drop.[xxxi]
It is noted that the U.S. Senate recently introduced two bills: the Offshore Wind Incentives for New Development Act and the Incentivizing Offshore Wind Power Act, which aims at extending an Investment Tax Credit (ITC) to offshore wind projects in the US.
It has yet to become apparent how far such investment and production credit schemes will lead to an increasing role for solar and wind in the energy mix of states that are already heavily invested in gas supply for power generation, which are also expected to remain cheaper compared to carbon-intensive coal and nuclear going forward.
One of the most significant challenges that impact upon reliability, competitiveness, and security of energy supply trade-offs and making informed choices in the unfolding carbon-constrained scenarios is intermittency of renewables like solar and wind and the need for better understanding of the potentials and the risks posed by current energy storage and demand response technologies.
Energy from the ‘sun’ and the ‘wind’ are in reality only available at the required scale when the sun shines, or the wind blows at the required intensity. Demand response frameworks and energy storage via batteries also need to be cost-efficient and reliable.
This article is an abridged version of a forthcoming paper on transitional energy markets.

[i] Tade Oyewunmi, Regulating Gas Supply to Power Markets: Transnational Approaches to Competitiveness and Security of Supply 1-360 at 15-30 (Wolters Kluwer, 2018)
[ii] Kevin B. Jones et al., The Electric Battery: Charging Forward to a Low-Carbon Future 121-123 (2017). States like New York and California have initiated several policies and regulatory process to increase the integration of distributed and intermittent renewables, as well as energy storage into their centralized energy supply grids.
[iii]US Energy Information Administration (EIA), Louisiana: State Profile and Energy Estimates, (February 21, 2019) at < https://www.eia.gov/state/?sid=LA>
[iv]The US Energy Information Administration (EIA), Louisiana and Wyoming consume the most energy per capita; Rhode Island, New York the least (September 4, 2018) < https://www.eia.gov/todayinenergy/detail.php?id=37012>
[v] Tade Oyewunmi, Regulating Gas Supply to Power Markets: Transnational Approaches to Competitiveness and Security of Supply 1-360 at 86-89 (Wolters Kluwer, 2018)
[vi] EIA, Louisiana: State Profile Analysis (last updated Feb. 21, 2019), www.eia.gov/state/analysis.php?sid=LA.
[vii]Ibid.
[viii]US EIA, Rankings: Average Retail Price of Electricity to Residential Sector, March 2019 (cents/kWh) (as at July 2019) < https://www.eia.gov/state/rankings/?sid=LA#/series/31>; other noted state’s average prices include Texas ($11.67), Vermont ($17.05), New York ($16.86) and California ($19.30).
[ix] La. Rev. Statutes Title 45, Ch. 3.
[x] Entergy Louisiana acquired Entergy Gulf State Louisiana, LLC (EGSL) in October 2015, but EGSL is still referenced in many Louisiana Public Service Commission (PSC) documents.
[xi] U.S. Dep’t of Energy (U.S. DOE), U.S. DOE Combined Heat and Power Installation Database (Dec. 2018), https://doe.icfwebservices.com/chpdb/.
[xii] See Bob Sprehe, La. DNR, Louisiana Electric Generation and Distribution Utilities: An Updated (2002) Tabulation of Louisiana’s Electric Power Generation Facilities (June 2005), http://www.dnr.louisiana.gov/assets/docs/energy/electricity/electric_2002.pdf.
[xiii] Cleco, Regulated Power Plants (2019), https://www.cleco.com/-/power-plants. For utilities operating in multiple states, aggregate data compiled from utility generation portfolios: Entergy, Generation Portfolio (2019), https://www.entergy.com/operations-information/generation-portfolio/; SWEPCO, 2017 Factsheet (2017), https://www.swepco.com/global/utilities/lib/docs/info/facts/factsheets/SWEPCOFactSheet2017_3_6-5-18.pdf.
[xiv] La. PSC, Louisiana Public Service Commission Website, http://www.lpsc.louisiana.gov/.
[xv] La. Rev. Statutes 45:1163(A)(1), (A)(3), (B).
[xvi] La. DNR, Government-Owned Electric Utilities: Municipal Power Authorities and Electric Utilities (1994), http://www.dnr.louisiana.gov/sec/EXECDIV/TECHASMT/electricity/electric_vol1_1994/005.htm.
[xvii] Regulated Industries: Introduction, 14 Fletcher Cyc. Corp. § 6677.
[xviii] See Entergy Louisiana, Inc. v. La. PSC, 539 U.S. 39 (2003).
[xix] See FERC, Regional Transmission Organizations (RTO)/Independent System Operators (ISO) (updated Oct. 2018), https://www.ferc.gov/industries/electric/indus-act/rto.asp; FERC, Electric Power Markets: Midcontinent (MISO), (updated July 2017), https://www.ferc.gov/market-oversight/mkt-electric/midwest.asp.
[xx] Entergy Louisiana, LLC, 2019 Draft Integrated Resource Plan (Public Version) (Oct. 2018), https://www.entergy-louisiana.com/userfiles/content/irp/2019/ELL_IRP_2019.pdf.
[xxi] See id. at 6.
[xxii] Oil and Natural Gas Sector: New Source Performance Standards and National Emission Standards for Hazardous Air Pollutants Reviews, 77 Fed. Reg. 49,490, 49,493 (Aug. 16, 2012) (codified at 40 C.F.R. pt. 60, subpt. 0000) and the Oil and Natural Gas Sector: Emission Standards for New and Modified Sources, 81 Fed. Reg. 35,824, 35,825-27 (June 3, 2016) (amending 40 C.F.R. pt. 60, subpt. 0000 and proposing new standards at subpt. OOOOa).
[xxiii] See for example the Oil and Natural Gas Sector: Emission Standards for New, Reconstructed, and Modified Sources Reconsideration, 83 Fed. Reg. 52,056 (Oct. 15, 2018) and the US EPA’s June 19, 2019 press release on the issuance of the final Affordable Clean Energy rule (ACE) – replacing the Clean Power Plan at <www.epa.gov/stationary-sources-air-pollution/affordable-clean-energy-rule>.
[xxiv]The US EPA, Regulatory Impact Analysis for the final Affordable Clean Energy Rule and Repeal of the Clean Power Plan (June 2019).
[xxv] Press Release, Entergy Louisiana Gets Approval to Buy Power From One of the Largest Solar Facilities Planned Entergy Newsroom (Feb. 21, 2019), https://www.entergynewsroom.com/news/entergy-louisiana-gets-approval-buy-power-from-one-largest-solar-facilities-planned/.
[xxvi] EIA, Electric Power Monthly (updated Apr. 2019), https://www.eia.gov/electricity/monthly/ (February 2019 Report provides data for December 2018 year-to-date prices).
[xxvii] See EIA, State Electricity Profiles (Jan. 8, 2019), https://www.eia.gov/electricity/state/.
[xxviii] 2019 Draft IRP, supra note 20 at 5.
[xxix] EIA, Levelized Cost and Levelized Avoided Cost of New Generation Resources in the Annual Energy Outlook 2019 (Feb. 2019), https://www.eia.gov/outlooks/aeo/pdf/electricity_generation.pdf.
[xxx] Id.
[xxxi] Brian Parkin, Cheap Renewables Shave $10 Trillion Off Cost to Curb Warming, Bloomberg Business (Apr. 8, 2019), https://www.bloomberg.com/news/articles/2019-04-09/cheap-renewables-shave-10-trillion-off-estimate-to-curb-warming.