

Super Bowl Market Indicator – Myth or Truth?
Does the winner of the Super Bowl correctly predict the upcoming direction of equities or is the Super Bowl market indicator just fun and games?
Super Bowl week is upon us. The Kansas City Chiefs attempt to become the first team to three-peat, while the Philadelphia Eagles try to avenge their loss to the Chiefs in Super Bowl 57. The Super Bowl is one of the most anticipated and watched sporting events of the year; it’s also one the most widely bet on. And believe it or not, some investors even use the outcome to forecast the direction of equity markets.
The Super Bowl Indicator is one of the crazier market indicators that I have heard over the years. The indicator goes something like this: the winner of the Super Bowl can predict the direction of the stock market during that calendar year. If the winning team hails from the American Football Conference (AFC, Chiefs), then the market will decline during that calendar year. Conversely, if the winning team hails from the National Football Conference (NFC, Eagles), markets will advance during the calendar year.
By leveraging Zephyr, I pulled the calendar year returns for the S&P 500 index since 1980 to see if the Super Bowl winner does indeed predict the upcoming direction of equities or if it’s just fun and games. I am confident in saying that formulating market expectations based on the winning Super Bowl team is not a sound investment strategy.
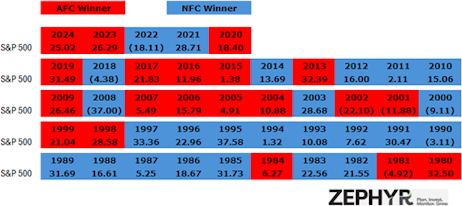
As you can see below in Figure 1, since 1980 the team representing the NFC has won the Super Bowl 25 times while the AFC team has won the big game 20 times. During those 45 years, the S&P 500 index experienced 37-years of positive returns and 8-years of negative returns. Of those 8-years of negative returns the AFC team, which is supposed to predict a negative year for equities, only won the Super Bowl 3-times, or 37.5% of the time. Conversely, during the 37-years of positive equity returns, the NFC team, which is supposed to predict a positive year for equities, won 20-times, or 54% of the time (Source: Zephyr).
Interestingly enough, during the great bull market of the 90’s, the NFC reigned supreme, winning the first eight Super Bowls of that decade, which followed up winning the last five Super Bowls of the 80’s which also corresponded to strong equity performance (Source: Zephyr).
While there are some trends that may suggest the outcome of the Super Bowl can predict the direction of equities during that year, such as the late 80’s and 90’s, the Super Bowl indicator is more myth and fun and games than actual truth. Remember, “correlation does not imply causation”.
With that, Fly, Eagles, Fly!
About the Author
As Zephyr’s Market Strategist, Ryan Nauman provides analysis and research on market trends across asset classes, sectors, and regions to help empower better asset allocation strategy decisions. He is an accomplished investment strategist who has spent the last 22 years in the investment management industry ranging from working with plan sponsors, managing the investments of retail investors, and providing actionable thought leadership to investment professionals.
Nauman is the host of the popular A to Zephyr and Adjusted for Risk podcasts. He is a well-respected investment industry strategist regularly featured on TD Ameritrade Network, Yahoo! Finance, Bloomberg TV, Bloomberg Radio and Chuck Jaffe’s Money Life podcast. His opinions and market expertise have been published in Reuters, CNBC, Bloomberg, MarketWatch.com, Yahoo! Finance, and the Wall Street Journal.