A rising tide lifts some (Japanese) boats: The Bank of Japan’s ETF purchases and their impact on market signals for individual stocks

“Purchases [of Japanese ETFs] by the Bank of Japan have been increasing. Such large and longstanding purchases of stocks by a central bank are rare in the world. It must be important to examine the effects of purchases of ETFs by the central bank,” Hideki Hanaeda, and Toshio Serita observed in the preamble to their paper, Effects of Nikkei 225 ETFs on Stock Markets: Impacts of Purchases by Bank of Japan, that was presented at the 30th Australasian Finance and Banking Conference in 2017.
At the time of their presentation the Bank of Japan (BoJ) was seven years into its ETF Purchasing Program, launched in early 4Q10 and expanded in 2013 as part of the “three arrows” policy launched by then Prime Minister Shinzo Abe to snap Japan out of the deflationary slowdown that started in 1991 and came to be known as the lost decades. It’s ETF holdings at the end of the year totaled some $175 billion with unrealized gains that added another $50 billion to the value of those holdings.
Four years later, the combined value of the BoJ’s domestic ETF holdings exceed $450 billion. It owns over 5% of the total market capitalization of the TOPIX index and, by some estimates, has acquired 70% of the total ETFs eligible under the terms of its current program. This makes it the largest shareholder, institutional or otherwise, in Japan, and the question of what this is doing to classic price, value and volatility metrics has taken on a new urgency.
In their paper, “A rising tide lifts some (Japanese) boats: The Bank of Japan’s ETF purchases and their impact on market signals for individual stocks”, four members of EPFR’s research team utilized the Informa company’s database of fund and stock level flows data to examine the degree to which the BoJ program is affecting Japanese stock prices – their research shows clearly that it does – and develop a factor that allows investors to compensate for, and profit from, the presence of a large, price insensitive buyer in Japan’s equity markets.
Their work added to the body of evidence that following the BoJ’s pattern and volume of EF purchases creates an additional alpha source in the cross-section of Japanese stocks.
The Bank of Japan’s big footprint
As the BoJ has been the pace-setter among central banks when it comes to purchasing non-government financial securities, the impact of those purchases on the assets involved is an obvious place to start. The BoJ was the first central bank to officially declare that it was buying exchange-traded funds (ETFs) and Japan Real Estate Investment trusts (J-REITs). Starting in December 2010, and proceeding at a higher pace from 2013, the BoJ expanded its holdings to the point it became the dominant player in Japan’s ETF market. As of December 2020, for instance, the BoJ owned around 5.3% of the TOPIX index's total market capitalization.
The impact of the BoJ ‘s policies becomes even more visible when viewed in the context of the total Japanese ETF market. Since the start of the program in 2010, the percentage of the market held by BoJ has grown exponentially to nearly 70% of the entire market going into the final month of 2020.
The BoJ’s purchases of domestic ETFs have also been a significant flow driver for Japanese equities. As can be seen from Exhibit 1a, passive ETF Flows were the main driver of the net flow from all mutual funds to Japanese equity markets over the past decade. Since 2010, passive ETF fund flows were the most significant fund flow component for the Japanese equities market 93 of the 131 months between 1Q10 and 4Q20. Actively managed mutual fund flows were the weakest investment vehicle in terms of flows over this period (Exhibit 1b) and, almost half of the time, positive inflows to passive ETFs compensated for negative flows to active mutual funds.
EXHIBIT 1a: Passive ETF Flows to Japanese Stocks – BoJ vs non-BoJ purchases

EXHIBIT 1b: Cumulative Flows to Japanese Stocks – BoJ vs non-BoJ purchases

As the BoJ became more critical in terms of flows for Japanese stocks, its purchases started to create discrepancies in terms of BoJ ownership at the stock level. Our analysis in this paper focuses on these discrepancies and suggests, through the development a simple investment factor based on BoJ purchases, how to profit from them. We show that utilizing the factor offers a robust way of exploiting BoJ purchases at the individual stock level. We also show this performance is not dependent on the benchmark selection or trading type and persists even when well-known factors are considered.
Theory…
Most of the core finance theories rely on the assumption that equity investors can trade as much as they wish without creating any significant price pressure. As Scholes (1972) puts it, buying a security from a firm is, in fact, equivalent to buying a contract which inherits the right to receive a (uncertain) future income stream. This, in turn, means that a firm can decrease or increase the number of securities available to investors without seeing any impact on that security price.
Recently, central bank policies and programs have attracted the attention of researchers, and there is already a significant amount of literature on quantitative easing (QE) programs and their effects on the securities as large scale asset purchases programs represent a perfect empirical laboratory for asset pricing.
Most of this research on QE programs and their impact has focused on fixed income assets, as most of these programs have involved the purchase of bonds with specific maturity or certain credit quality. Compared to bond market interventions, there is a limited amount of research done on the effects of central banks' stock market purchases. Because of that, the BoJ purchases of ETFs since 2010 provide a unique opportunity. EPFR’s work complements Charoenwong, Morck, and Wiwattanakantang (2019) and Barbon and Gianinazzi (2019), which both conclude that ETF purchases made by the BoJ do increase share prices and that the ‘BoJ premium’ does not revert in the short term.
The research utilizes a stock level fund allocation and flows dataset compiled by EPFR, part of Informa Financial Intelligence (IFI). The fund flows database, which covers mutual funds and exchange-traded funds (ETF), contains as reported daily, weekly, and monthly data points from more than 18,000 equity funds and 9,300 bond funds from all domiciles. It also includes information from a sub-set of reporting funds on their total assets under management (AuM).
This analysis focuses exclusively on equity ETFs that
- (a) have a mandate to invest in Japan,
- (b) explicitly track the Tokyo Stock Price Index (TOPIX), Nikkei 225 Stock Average, JPX-Nikkei Index 400 and J-REIT index and
- (c) are eligible for purchase by the BoJ under its current QE programs.
It also utilizes the Bloomberg database to obtain monthly stock returns and market capitalizations for our universe of TOPIX stocks.
The total sample includes 3,325 securities. These are the stocks that are (or were) included in the TOPIX between January 1, 2013 and December 31, 2019. These dates correspond, respectively, to the beginning and the ending of our sample period for returns and market capitalizations.
…. and practices
Funds eligible for the BoJ’s open market ETF purchase must track the TOPIX, Nikkei 225 Stock Average, JPX-Nikkei Index 400 or J-REIT index. As of December 2019, there were 42 ETFs tracked by EPFR that met these criteria with a collective AUM of $375 million. Panel A of Exhibit 2 lists the total number of funds and assets under management by benchmark.
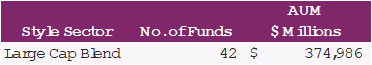
Panel B contains the total number of funds and AuM by fund domicile. The majority of the assets tracked are domiciled in Japan and, as can be seen in Panel C, all the eligible ETFs fall under large cap blend category. The reflects the simple fact the eligible benchmarks are constituted from large cap securities.
EXHIBIT 2: Eligible ETF Distribution (December 31, 2019)
Panel A: Distribution by Benchmark
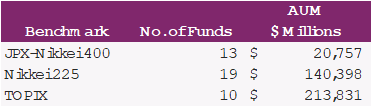
Panel B: Distribution by Fund Domicile
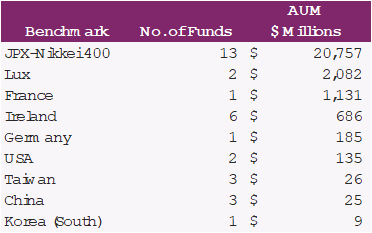
Panel C: Distribution by Fund Style Sector
Drawing from this pool of data, we set out to create a factor that captures the alpha stemming from the BoJ’s active involvement in Japan’s ETF market.
First, we limit the scope of funds to ETFs that are Bank of Japan purchase eligible – exchange traded funds that are benchmarked to TOPIX, Nikkei 225 Index, JPX-Nikkei Index 400 and J-REIT Index. By summing the product of fund asset under management and stock allocation, we can compute the indicator as the ratio of eligible assets divided by market capitalization for each individual security. We then take the average of these monthly percentages over a trailing horizon of 1-month, 3-month, and 6-month to yield three predictors.
The latest fund holdings used by the indicator is known 26 days after each month. Hence, we cannot trade at Japan equity securities during the month the latest data captures, but instead must trade on the following month end. We explicitly account for this delay in the rest of this study.
At every month end, we will first use the most recent AuM Eligible% over a trialing horizon for each security to calculate the factor value. Secondly, the factor values will be fitted onto a normal cross-sectional distribution and the Z scores calculated.
The Z scores are calculated as taking the factor value of each security minus the cross-sectional average and dividing by the cross-sectional standard deviation. We take the average of the Z score distribution (the center point) and calculate the difference between the Z score of each stock and the average. The length of the vector from the center of the distribution for the Z scores will provide the measure of a securities’ relative overweight or underweight that is used to adjust the base portfolio. Here, the hypothetical base portfolio is constructed by following passive Japan dedicated ETFs’ average stock allocation as an approximation for a market cap portfolio.
The back test for this factor rebalances monthly and takes into consideration the 26-day delay of the data by lagging these indicator returns by two months.
All performance and returns are reported on a pre-cost basis.
Results…
To see whether this factor can predict future returns, the paper looks at monthly returns on portfolios formed by sorting securities using the AuM Eligible % factor.
Overall, the hypothetical portfolio outperforms the TOPIX benchmark in terms of both total and excess returns. Panel A of Exhibit 4 reports the performance summary of the AuM Eligibility% factor. During seven-years back testing period, the hypothetical portfolio yields a 97% total return, compared to 58% return for the TOPIX benchmark, resulting in a 39% total excess return. The portfolio also outruns the benchmark in terms of Annualized Return, Average Return and Median Return.
EXHIBIT 4:
Panel A: Backtest Performance
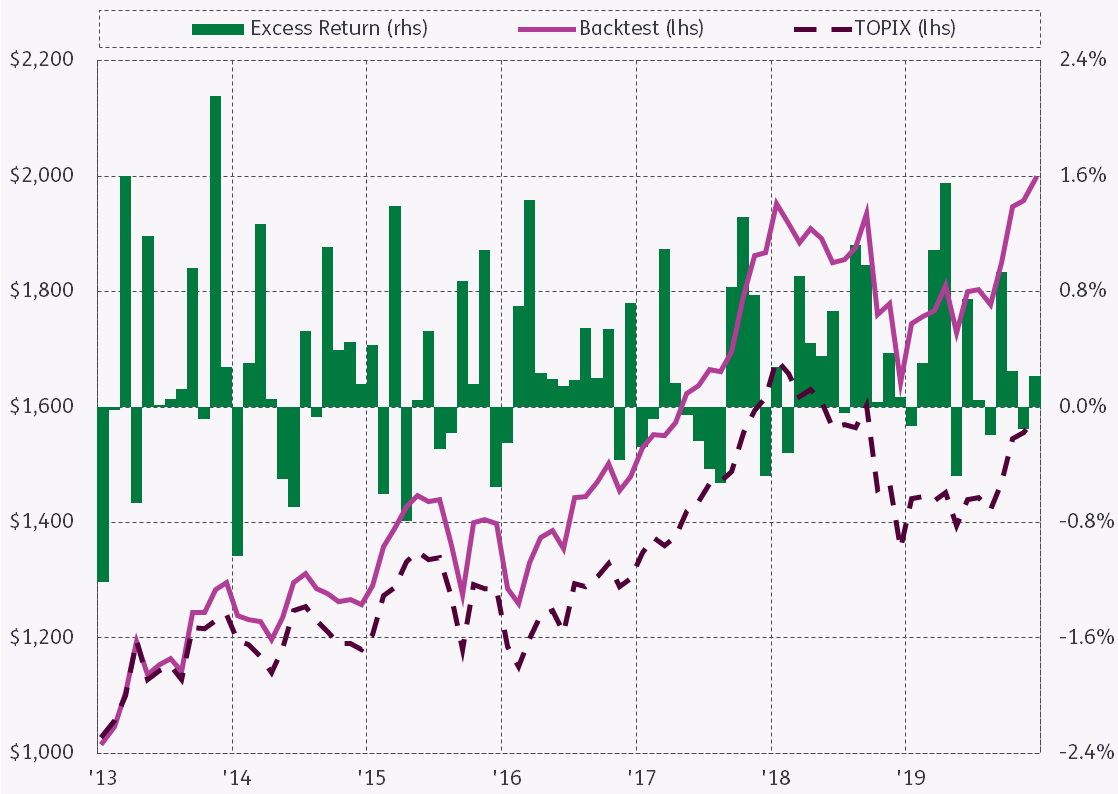
Panel B: Annual Performance, and Annual Excess Performance
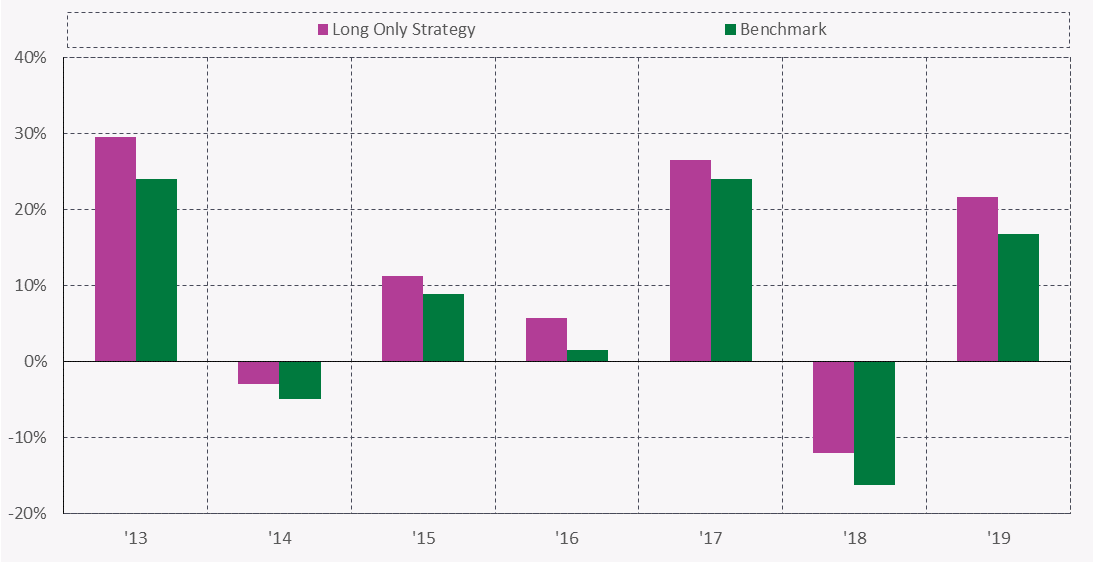
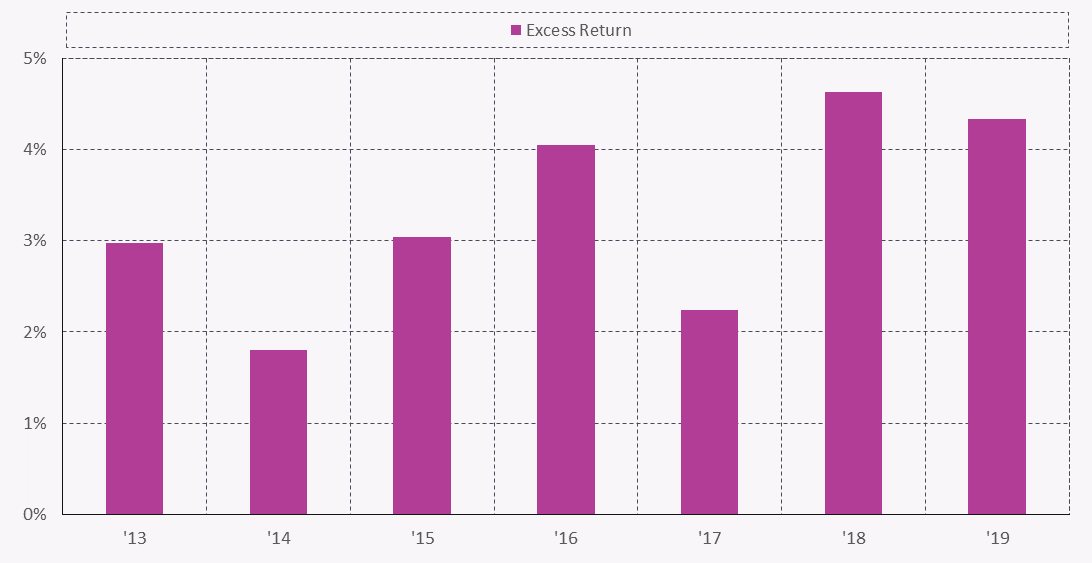
Panel C: Performance Characteristics
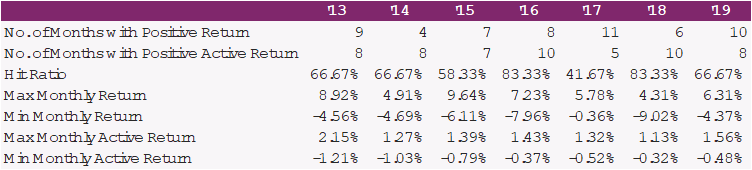
When it comes down to risk-adjusted returns, this paper utilizes an Information Ratio to assess the effectiveness of the factor. In this case, the Information Ratio (IR) is a measurement of the excess portfolio returns compared to the benchmark, adjusted for the volatility of those returns. With a 10.15% annualized active return, and 2.75% tracking error, the portfolio gives a 1.2 Information Ratio.
These results were checked by regressing them against the Fama French Five-Factor Model, an asset pricing model developed in 2014 that expands on the previous Fama French Three-Factor Model by adding operating profitability risk and investment portfolio risk to the old-fashioned size risk, value risk, and market risk factors suite.
Finally, the authors tested the efficacy of such publicly available factors and their relationship with AuM Eligible% factor. The AuM Eligible% factor portfolio outperforms portfolios driven by publicly available factors such as EPS (earnings per share) and PB (price to book), even when correlated elements of the AuM Eligible% factor are stripped out of the publicly available factors.
This highlights two attributes of the AuM Eligible% factor: it is not highly correlated with publicly available factors and it will outperform even after being orthogonalized.
Conclusion
Purchases of non-government financial securities will remain a key tool for global central banks in the coming years. Indeed, its use in equity markets is likely to expand beyond Japan.
Unlike purchases of government securities, non-government purchases have the potential to create disproportioned effects on single securities. This might
- (a) create an additional source of return for investors who are tracking the central bank movements in the cross-section of single securities and
- (b) decrease the effectiveness of the purchase program by not giving broadly equal boost to all targeted securities.
The ETF purchase program of the Bank of Japan has been a powerful tool in supporting the markets in recent years. In this work, we have provided additional evidence that following the BoJ’s pattern and volume of EF purchases would have created an additional alpha source in the cross-section of Japanese stocks. These effects were existent, even when other financial variables, benchmarks, or factors were considered.
We also developed a factor that reliably captures some of the alpha generated by the BoJ’s direct involvement in Japan’s equity markets.
For more information: sales.financial@informa.com

References
Barbon, Andrea, and Virginia Gianinazzi. "Quantitative easing and equity prices: Evidence from the ETF program of the Bank of Japan." The Review of Asset Pricing Studies 9.2 (2019): 210-255.
Coval, Joshua, and Erik Stafford. "Asset fire sales (and purchases) in equity markets." Journal of Financial Economics 86.2 (2007): 479-512.
Charoenwong, Ben, Randall Morck, and Yupana Wiwattanakantang. Asset Prices, Corporate Actions, and Bank of Japan Equity Purchases. No. w25525. National Bureau of Economic Research, 2019.
D’Amico, Stefania, and Thomas B. King. "Flow and stock effects of large-scale treasury purchases: Evidence on the importance of local supply." Journal of Financial Economics 108.2 (2013): 425-448.
Gagnon, Joseph, et al. "Large-scale asset purchases by the Federal Reserve: did they work?." FRB of New York Staff Report 441 (2010).
Greenwood, Robin. "Short-and long-term demand curves for stocks: theory and evidence on the dynamics of arbitrage." Journal of Financial Economics 75.3 (2005): 607-649.
Hancock, Diana, and Wayne Passmore. "How Does the Federal Reserve's Large‐Scale Asset Purchases (LSAPs) Influence Mortgage‐Backed Securities (MBS) Yields and US Mortgage Rates?." Real Estate Economics 43.4 (2015): 855-890.
Harada, Kimie, and Tatsuyoshi Okimoto. The BOJ's ETF Purchases and Its Effects on Nikkei 225 Stocks. RIETI, 2019.
Hanaeda, Hideki, and Toshio Serita. "Effects of Nikkei 225 ETFs on Stock Markets: Impacts of Purchases by Bank of Japan." 30th Australasian Finance and Banking Conference. 2017.
Ide, Shingo and Hitoshi Takehara (2017), The BOJ's ETF purchasing and its effects on price [Nihon ginko niyoru ETF kaiire ga kabuka hakken ni ataeta eikyo: kobetsu meigara tick data wo mochiita bunseki] (in Japanese), mimeograph.
Kaul, Aditya, Vikas Mehrotra, and Randall Morck. "Demand curves for stocks do slope down: New evidence from an index weights adjustment." The Journal of Finance 55.2 (2000): 893-912.
Krishnamurthy, Arvind, and Annette Vissing-Jorgensen. The effects of quantitative easing on interest rates: channels and implications for policy. No. w17555. National Bureau of Economic Research, 2011.
Rodnyansky, Alexander, and Olivier M. Darmouni. "The effects of quantitative easing on bank lending behavior." The Review of Financial Studies 30.11 (2017): 3858-3887.
Scholes, Myron S. "The market for securities: Substitution versus price pressure and the effects of information on share prices." The Journal of Business 45.2 (1972): 179-211.
Shleifer, Andrei. "Do demand curves for stocks slope down?." The Journal of Finance 41.3 (1986): 579-590.
Shen, Steven and Baronyan, Sayad and Srimurthy, Vikram and Brandt, Cameron, A Rising Tide Lifts Some (Japanese) Boats: The Bank of Japan's ETF Purchases and Their Impact on Market Signals for Individual Stocks (March 13, 2021). Available at SSRN: https://ssrn.com/abstract=3803864