Alternative Data in Quantitative Strategies: Use Cases

Quantitative strategies all aim at maximising returns while limiting risk. Alternative data can become the stepping stone to achieve this, by applying algorithms first to make sense of complex unstructured data and then transform it into investment insights. SESAMm’s quantitative and Machine Learning team present here some of their findings, exploiting Natural Language Processing combined with simple quantitative analysis to build systematic investment strategies.
This article describes a Natural Language Processing methodology aimed at creating investment signals. It also presents simple quantitative use cases, showing that the initial steps of exploring alternative data do not always require a full Machine Learning approach.
1. Emotions and Sentiments
The goal of SESAMm’s NLP technologies is to provide the most accurate assessment of the opinion and “affect” of people in several types of documents (social media, news, forums, etc., 250,000+ data sources). The objective is to draw meaningful insights about the psychological mood of the population. These insights are drawn on a daily basis and then correlated with market movements.
The core aspect we are interested in is the concept of sentiment, a description of the psychological state of individuals in terms of positivity, negativity and neutrality. It is analogous to the pleasure psychological trait in the pleasure-arousal-dominance model (Mehrabian, 1996) and is widely used in literature. Sentiment is a powerful indicator, though it is quite simple. Compare for instance "I can't stand this!" and "This is horrible...". Both are displaying a negative sentiment, but the former shows an anger-tainted emotion while the latter shows a fear-tainted emotion. We thus rely on the primitive emotions described by psychologist Paul Ekman: joy, fear, sadness, surprise, and anger.
2. NLP Technologies
SESAMm’s NLP technologies rely on manually crafted rules and a strong supervised Machine Learning component. This kind of technology has been available since the work of Pang et al. (2002) and has surged in the last ten years. Supervised machine learning relies on large datasets called corpora, associating documents and their expected polarity. For instance, it could contain thousands of messages such as "It is awesome!!!" paired with the expectation (here high positive sentiment). The system then learns automatically that the word "awesome" is most likely the one displaying a positive sentiment while the words "it" and "is" are most likely not associated to any sentiment. The punctuation also matters, compare for instance "It's cool!!!" and "It's cool...."; the latter appears less positive than the former. Other methods including semi-supervised and unsupervised machine learning are also included in parts of our systems.
Our supervised system is able to return classification probabilities for each type of sentiment or emotion given an input document. For instance, it might assess that "It is awesome!!!" is most likely an expression of joy but could also be an expression of surprise. The supervised approach requires the development of annotated corpora to train the systems. These corpora are generally costly to build: it is first required to collect the data while avoiding biases (for instance collecting too many of documents of a given type), it is
then necessary to annotate them, that is, to manually associate the expectation to the documents.
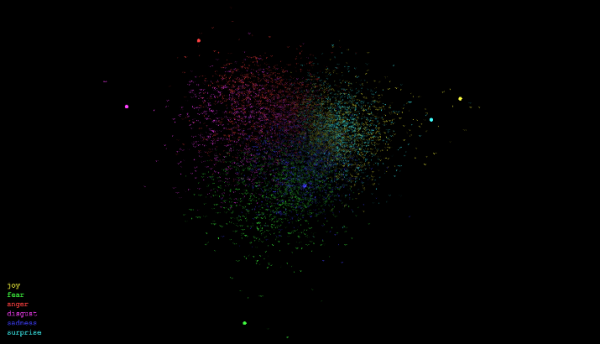
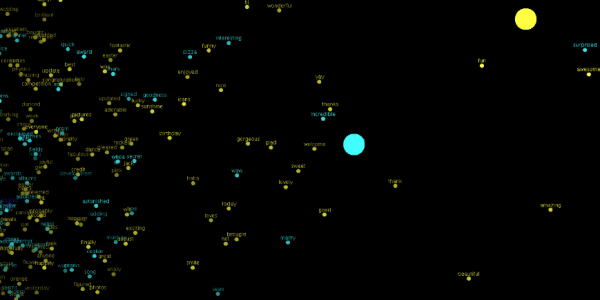
Combination of both deep learning and distant supervision. Large dots represent seed concepts, such as anger (in red), words are projected in a 2-dimensional space based on distance to seed concepts (learned in a training process)
Combination of both deep learning and distant supervision. Large dots represent seed concepts, such as anger (in red), words are projected in a 2-dimensional space based on distance to seed concepts (learned in a training process)
Combination of both deep learning aCombinationnd distant supervision. Lsupervision. Large dosupervision. Large dosupervision. Large doarge dots
Combination of both deep learning and distant supervision. Large dots represent seed concepts, such as anger (in red), words are projected in a 2-dimensional space based on distance to seed concepts (learned in a training process)
3. Quantitative Use Case: Long Only
A simple way to construct a Long Only portfolio using alternative data is to screen stocks according to a certain level of sentiment or emotion. For instance, regarding a US stocks universe (500 stocks), one can rank stocks according to the moving average (on the past month) of an indicator and then split them into vingtile buckets (~25 stocks). At the end of the process, one can hold the two extremes legs, the first vingtile (called “highest” below) and the last vingtile (called “lowest” below):
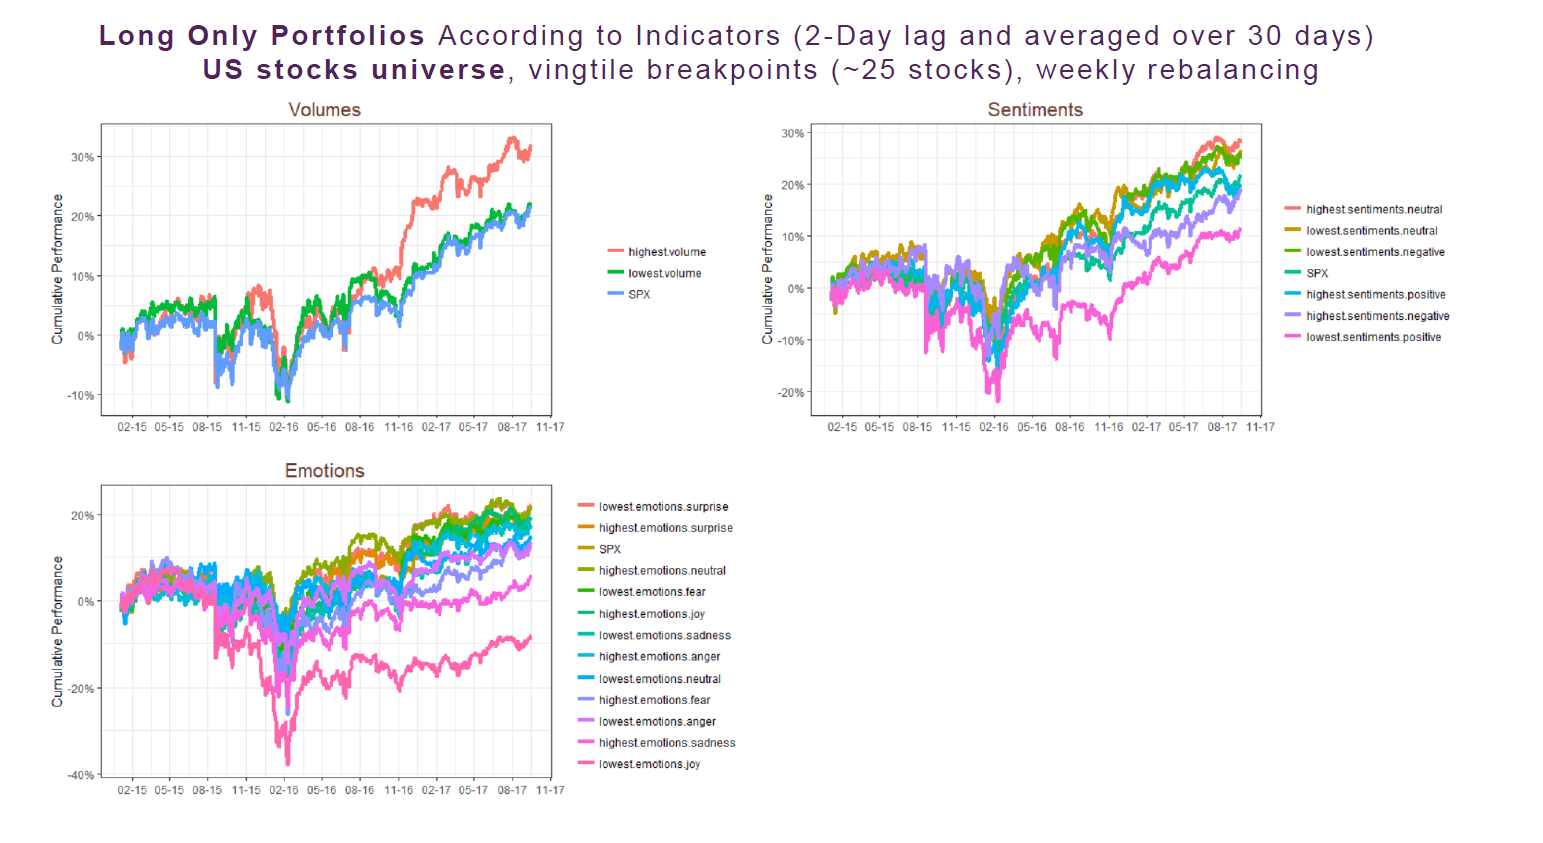
Thus, the above graphs synthesise the cumulative performance of this simple trading strategy for every indicator (Volume, Emotions, and Sentiments) extracted from the database. As you can see, most of the stock baskets show positive cumulative return and those that underperform the market are consistent with intuition (lowest joy, highest fear, highest negative sentiment…).
4. Long/Short on Stocks
When it comes to stock-level granularity, in order to build a Long/Short strategy, one needs to find a way to characterise each stock compared to a systematic component. This should be common to all stocks and could allow to exploit arbitrage opportunities. This is the intuition behind the following methodology which estimates systematic linear coefficients for all stocks, and then discriminates among stocks with individual emotional indicators.
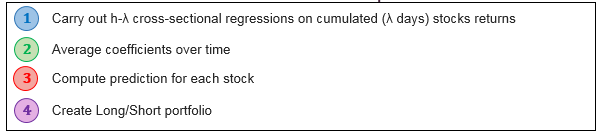
Methodology (Example with Emotional Agitation* Only)
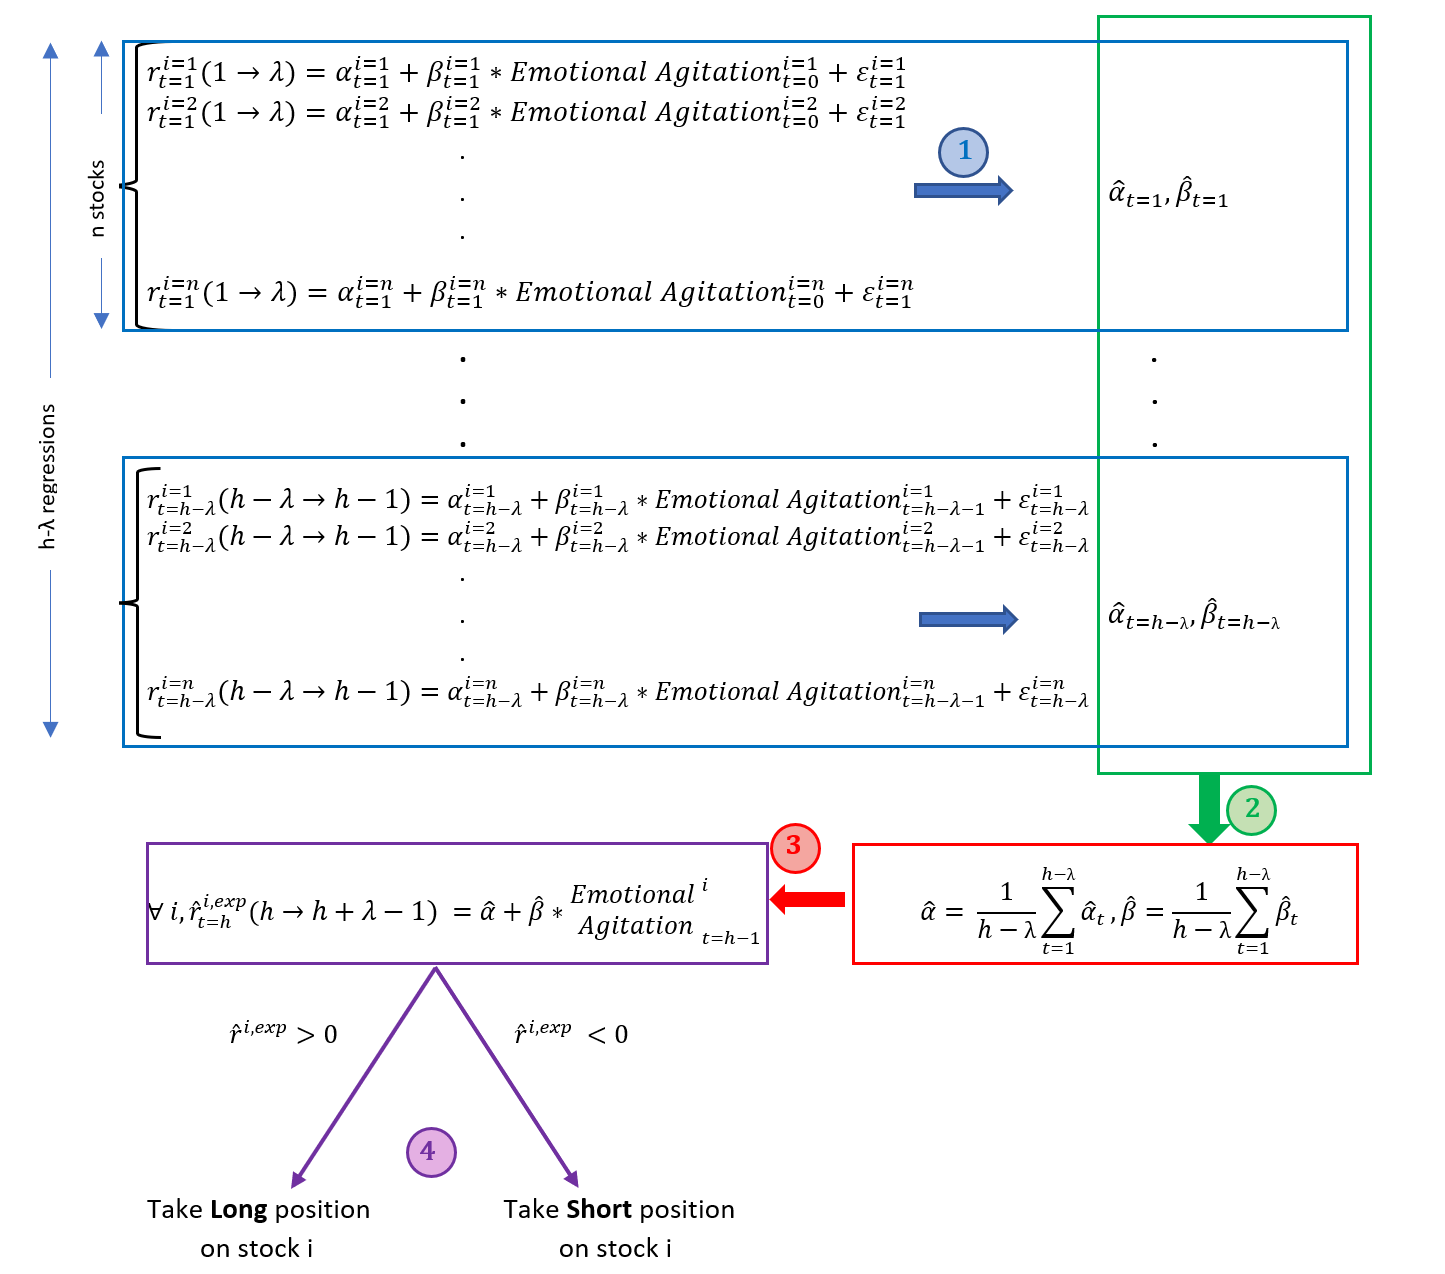
Portfolio Construction Steps
Fh w) wrthoresults is pvgdgdhrdhdhdhfghfghfghfgjfjfjfgjesented below for the DAX 30 universe:
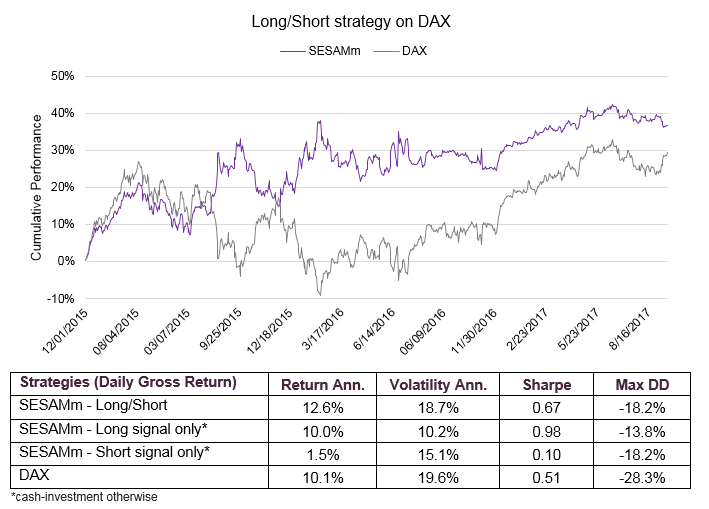
For a weekly rebalancing frequency (λ=5), we simulate for each week an investment in a basket of n stocks (e.g., 30 for the DAX) where the position (Long or Short) has been determined by the previous methodology. A summary of the results is presented below for the DAX 30 universe:
.
As described in the previous table, both Long and Short long/Short
As described in the previous table, both Long and Short legs contribute to the global out performance of the Long/Short strategy.
The strategy also exhibits a much lower maximum drawdown than the market, due to the capacity of our explaining variable (Emotional Agitation) to anticipate market correction.
Concluding remarks
This study described SESAMm’s NLP methodology for generating useful alternative data and presented some simple quantitative trading use cases. The examples described here are only a few of many possibilities and SESAMm usually also performs machine learning tasks on these datasets to create trading signals, including for live strategies.
The following remarks apply to this study:
- SESAMm’s sentiments and emotions indicators show that there is a premium to be extracted from unstructured text data once NLP has been applied;
- Signals can be exploited in both Long Only and Long/Short frameworks for Top-down (e.g., universe reduction by stock emotional screening) and Bottom-up (e.g. stock selection using quantitative signals built from emotional indicators) approaches;
- Further improvements of quantitative strategies could include a sector neutral approach to mitigate economic cyclical risk and filter stocks according to specific characteristics (e.g. low volatility, high earning yield…) before applying some of these methodologies;
- One can use higher frequencies (minute, hour) for aggregated indicators and add fundamental data to extract a higher explained variance;
SESAMm offers access to its alternative data and Premium Services to help client leverage alterative data and Machine Learning in quantitative use cases.
Read the original whitepaper here >>