Analysing Covid-19 Data with AWS Data Exchange, Amazon Redshift, and Tableau

By Kevin Glover, Product Manager, Tableau Software
Brandon Schur, Software Engineer, Amazon Redshift
Srinivas Kesanapally, Partner Solutions Architect, AWS
Arif Razvi, Head of Partnerships, AWS Data Exchange
As COVID-19 upends our health, our economy, our world, and our daily lives, people in every sector and country are turning to data to stay informed, share information, and respond with confidence.
Organizations are using COVID-19 data to make critical decisions confidently and quickly. Data is helping healthcare workers, researchers, scientists, public health officials, and first responders on the front lines as they care for patients, search for therapies, educate the public, influence policy, and communicate action plans.
To help everyone visualize COVID-19 data confidently and responsibly, we brought together Amazon Web Services (AWS) partners Salesforce, Tableau, and MuleSoft to create a centralized repository of trusted data from open source COVID-19 data providers.
Anyone can work with the public data, blend it with their own data, or subscribe to the source datasets directly through AWS Data Exchange, and then use Tableau to better understand the impact on their organization. We are actively working with partners to gather and maintain a complete set of trusted data and will be adding new reliable sources as they become available.
In this post, we explain how to access and analyze this data using AWS Data Exchange and Amazon Redshift together with Tableau Software, an AWS Partner Network (APN) Advanced Technology Partner with the AWS Data & Analytics Competency and Amazon Redshift Ready designation.
We also encourage you to visit the AWS COVID-19 Data Lake — a centralized repository of up-to-date and curated datasets on, or related to, the spread and characteristics of the novel corona virus (SARS-CoV-2) and its associated illness, COVID-19.
Dashboarding COVID-19 Data
We’ll go over three different ways of dashboarding COVID-19 data using AWS services together with Tableau:
- Analyzing and dashboarding COVID-19 datasets using AWS Data Exchange, Amazon Redshift, and Tableau. This approach is suggested for customers who are already using Amazon Redshift and would like to build a dashboard using Tableau.
- Analyzing and dashboarding COVID-19 datasets using AWS Data Exchange, Amazon Athena, and Tableau. This approach is suggested for customers who are already using Amazon Athena or have just started using AWS and would like to build a dashboard using Tableau.
- Analyzing and Dashboarding COVID-19 datasets using the AWS COVID-19 Data Lake, Amazon Athena, and Tableau. This approach is suggested for customers who are new to AWS and would like to quickly build a dashboard using Tableau.
Data from the AWS COVID-19 Data Lake is intended to be used for COVID-19 related research and development, and supports analytics in place with the data.
If you want to use the data for more commercial purposes (for example, product demand forecasting) not related to COVID-19 research and development, you can find more than 125 different COVID-19 related data products on AWS Data Exchange. This includes data on which states and counties that your business operates in are the best and worst at implementing social distancing.
The data can also help you get insights into societal activity across common public places like airports, banks, and drug stores from Foursquare. It also provides information about global flights available as you consider mobilizing any of your staff for regular commuting to the office or travel, either interstate or internationally. You can subscribe to as much data as you need to manage your business effectively through AWS Data Exchange.
Architecture 1
The architecture diagram in Figure 1 shows how to ingest data into AWS Data Exchange and Amazon Redshift and dashboard it using Tableau. It also shows you how to create a dashboard using Tableau Public, a free software from Tableau that allows anyone to create interactive data visualization for the web.
---
 Figure 1 – Analyzing and dashboarding using AWS Data Exchange, Amazon Redshift, and Tableau.
---
Data Flow
- The COVID-19 Data Platform ingests and aggregates data across public sources, including The New York Times, European Centre for Disease Prevention and Control, and the COVID Tracking Project. The platform curates them into standardized data models, and Tableau Data Prep, a tool in the Tableau product suite, performs extract, transform, and load (ETL) work.
- Tableau Data Prep converts the uploaded COVID-19 datasets into csv, tde (Tableau Data Extract format, recognized by Tableau Desktop for rendering) and hyper (newer Tableau Data Extract format, recognized by Tableau Desktop for rendering) formats.
- These files are compressed in zip format and can be uploaded to Tableau Public. The zip files are also uploaded to Amazon Simple Storage Service (Amazon S3) bucket.
- Amazon S3 triggers an Amazon CloudWatch Event that invokes an AWS Lambda function to upload the data into AWS Data Exchange.
- Every time a new revision is published, AWS Data Exchange publishes a CloudWatch Event sourced from AWS Data Exchange.
- A CloudWatch event rule triggers a Lambda function that creates an AWS Data Exchange job to export the revision’s assets to a predefined S3 bucket.
- On object creation, an Amazon S3 event notification triggers a Lambda function named RedshiftLoadLambda.
- This Lambda function ensures data is not duplicated and loads the freshest dataset via the COPY command into Amazon Redshift.
The AWS CloudFormation template linked to below automates loading the data from AWS Data Exchange into Amazon Redshift. Before launching the CloudFormation template, make sure you are subscribed to the dataset and have an Amazon Redshift cluster configured for identity and access management (IAM) authentication and the COPY command from S3.
You can optionally specify a subnet id and security group for the AWS Lambda function RedshiftLoadLambda if your Amazon Redshift cluster is in a private subnet. Note that the subnet the Lambda function runs in will need network access (via a NAT, for example) in order to make the needed API calls for AWS IAM authentication.
After successful completion of loading the data into Amazon Redshift, you can connect to Amazon Redshift from Tableau Desktop and start building dashboards.
Architecture 2
The architecture diagram in Figure 2 shows how to ingest data into AWS Data Exchange, and dashboard it using Tableau and Amazon Athena. It also shows you how to create a dashboard using Tableau Public.
---
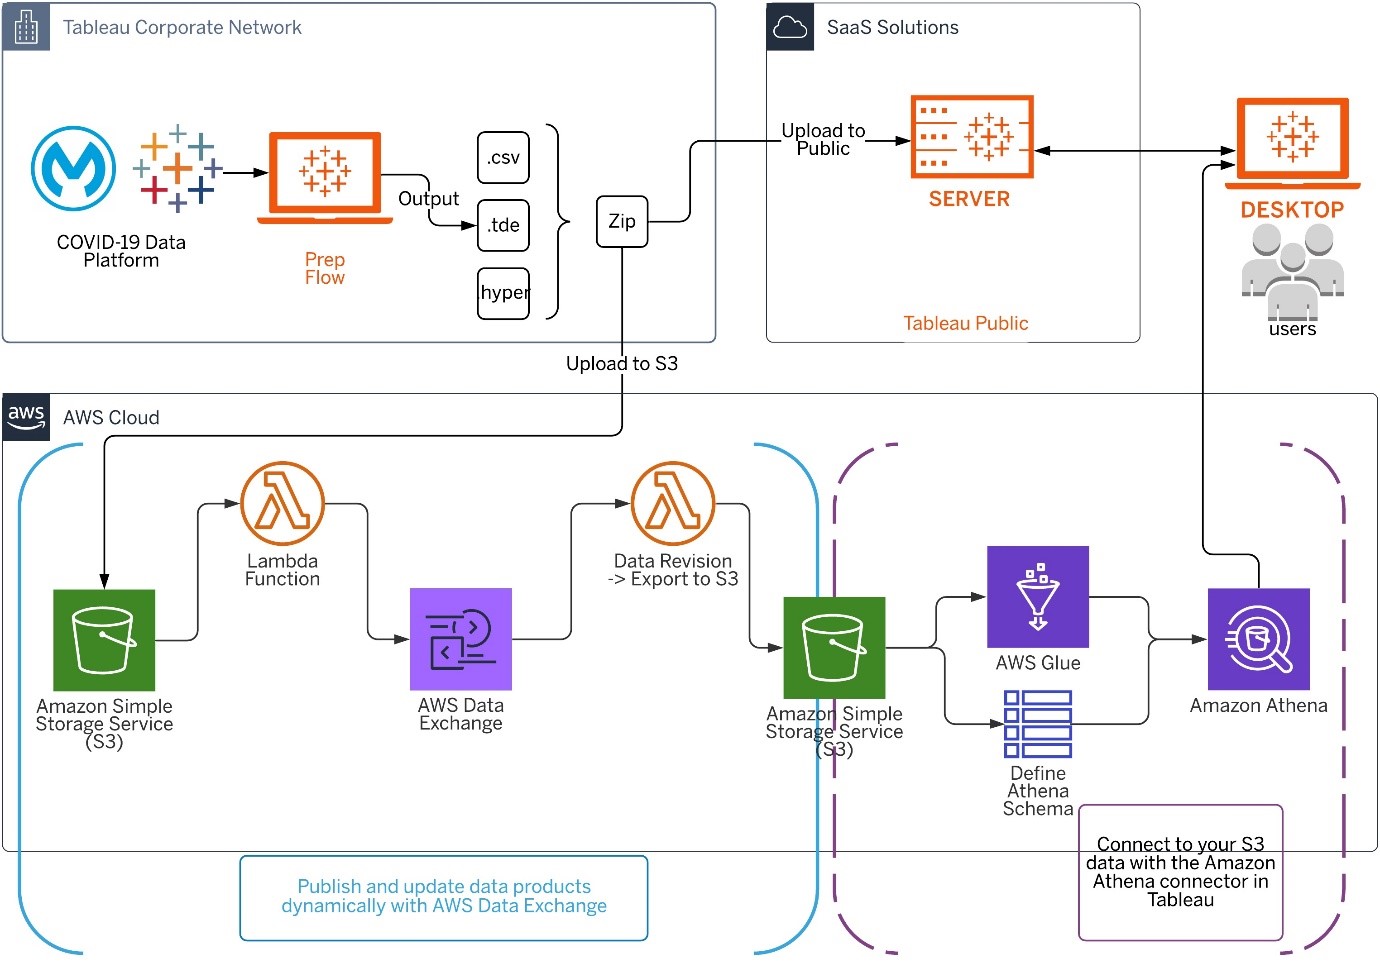 Figure 2 – Analyzing and dashboarding using AWS Data Exchange, Amazon Athena, and Tableau.
---
Data Flow
- The COVID-19 Data Platform ingests and aggregates data across public sources, including The New York Times, European Centre for Disease Prevention and Control, and the COVID Tracking Project. The platform curates them into standardized data models, and Tableau Data Prep performs ETL work.
- Tableau Data Prep converts the uploaded COVID-19 datasets into csv, tde, and hyper formats.
- These files are compressed in zip format and can be uploaded to Tableau Public. The zip files are also uploaded to an Amazon S3 bucket.
- Amazon S3 triggers an Amazon CloudWatch event that invokes an AWS Lambda function to upload the data into AWS Data Exchange.
- Every time a new revision is published, AWS Data Exchange publishes a CloudWatch event sourced from aws.dataexchange.
- A CloudWatch event rule triggers a Lambda function that creates an AWS Data Exchange job to export the revision’s assets to a predefined S3 bucket.
- Connect to Amazon S3 bucket from Tableau Desktop to build dashboards using Amazon Athena that uses AWS Glue Data Catalog internally to fetch the data from S3.
Architecture 3
The architecture diagram in Figure 3 shows how to dashboard using Tableau Desktop and the publicly available AWS COVID-19 Data Lake.
---
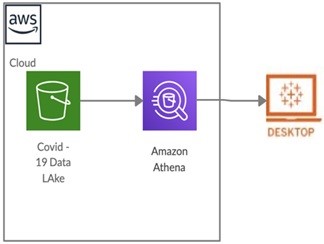 Figure 3 – Analyzing and dashboarding using the public AWS COVID-19 Data Lake and Tableau.
---
Data Flow
- Connect to the AWS COVID-19 Data Lake from Tableau Desktop using Amazon Athena.
- Create dashboard using Tableau Desktop.
Summary
In this post, you have learned how to create COVID-19 dashboards using Tableau and different AWS services, such as AWS Data Exchange, AWS COVID-19 Data Lake, Amazon Redshift, and Amazon Athena.
Subscribe to COVID-19 datasets from AWS Data Exchange and run the provided AWS CloudFormation template to start creating Tableau dashboards using Amazon Redshift.