Assessing risk-profile of quant strategies: the convexity vs skewness

All quantitative strategies have specific risk profiles characterized by the skewness of returns, performance in tail events, and cyclicality risk, when strategies perform only in certain market cycles. Artur Sepp, Director And Senior Quant at Julius Baer Group, has previously discussed the cyclicality risk of quantitative strategies and here looks at convexity vs. skewness.
This year at QuantMinds International, I presented my latest work on Machine Learning (ML) for volatility estimation and prediction. The goal of applying ML for systematic trading is to improve the risk-profile of quant strategies and reduce the risk of back-test over-fit. I would like to introduce my presentation by discussing the risk-profile of quantitative strategies using the two key risk metrics.
- Skewness of realized returns. The skewness serves as a static measure of the third order risk-profile of investment strategies. Strategies with the negative skewness typically include carry and mean-reversion strategies, in which frequent small gains are followed by infrequent large losses. Strategies with positive skewness tend to include trend-following and long volatility strategies, in which case strategies tend to produce infrequent large gains followed by a series of frequent small losses.
- Convexity of realized returns with respect to the flagship index or benchmark. I define the convexity as the beta coefficient of strategy returns to the square of returns on the benchmark. In this way, the convexity measures the dynamic risk of strategy performance in tails of the performance of the flagship index. On one hand, the strategies with negative convexity underperform considerably the index in stressed periods with large negative performance on the index and yet they tend to underperform the benchmark when it produces large positive gains. On the other hand, the strategies with positive convexity tend to outperform the benchmark in both negative and positive periods with strong emphasis on delivering positive performance in stressed periods.
The quantitative way to analyze the convexity profile of a quantitative investment strategy is to estimate the quadratic (parabolic) regression of returns on the strategy predicted by returns on the flagship or benchmark index and index returns squared:
The estimate of the linear beta indicates the direct first-order exposure to the performance of the benchmark index. Market-neutral strategies have insignificant linear betas. The estimate of the convexity beta assesses the second-order exposure indicating how the strategy performs in markets with strong bias to either downside or to upside. The convex strategies benefit from extreme returns on the benchmark index while the concave strategies suffer in extreme markets. The alpha is the estimate of the excess return that the strategy can generate.
Illustrations using hedge fund indices
To illustrate the risk profile of different quantitative strategies, I apply hedge fund indices that show the aggregated performance of niche quant hedge funds (HF):
- Short Vol HF index is CBOE Eurekahedge Short Volatility Index measuring the equal-weighted performance of 13 hedge funds which have short exposures to the implied volatility.
- Relative Value Vol HF index is Relative Value Volatility Hedge Fund Index of 35 hedge funds that run volatility strategies with long, short, or neutral exposure using the relative value approach.
- Long Vol HF index is Long Volatility Index of 11 hedge funds that have net long exposures to the implied volatility.
- Tail Risk HF index is Tail Risk Hedge Fund Index including 8 hedge funds that seek to generate significant upside during market stress periods.
- SG Trend-following CTAs is SG Trend Index (NEIXCTAT Index) consisting of 10 systematic trend-following commodity trading advisors (CTAs).
Both the CBOE HF and SG CTA indices are equal-weighted and reconstituted annually accounting for the survivorship bias. CBOE HF indices are updated on monthly basis while the SG trend-following CTAs index is updated daily. The time series of monthly returns for the first three Eurekahedge HF indices are available from January 2005, the data for Tail Risk HF index and SG Trend-following CTAs are available from January 2008 and January 2000, respectively.
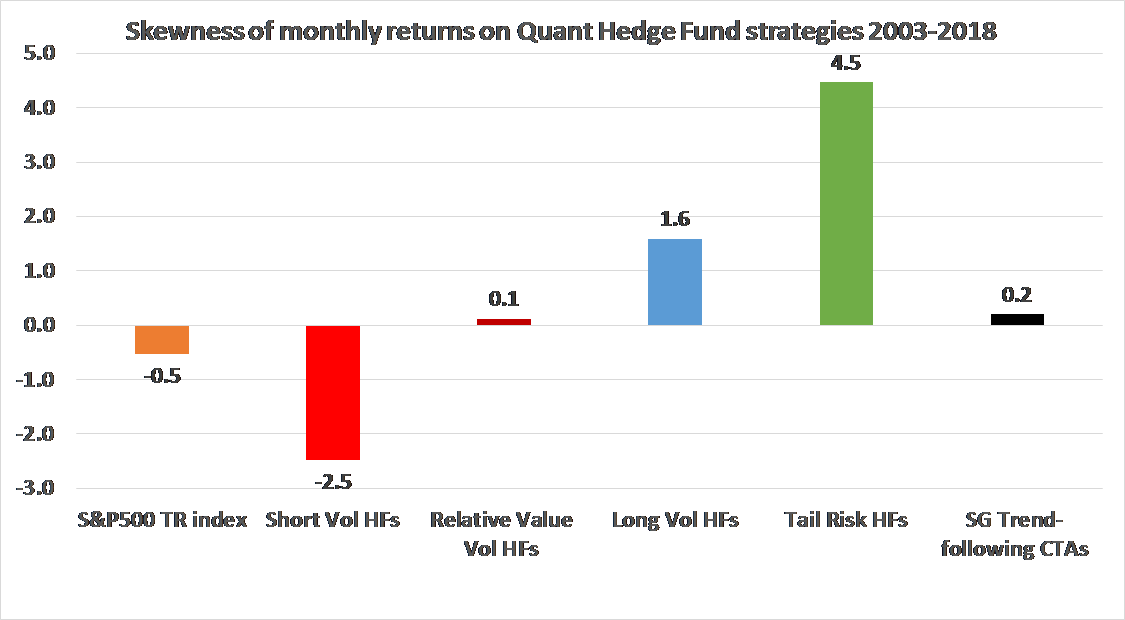
In the figure below, I show the realized skewness on the HF strategies. The short vol strategies are the most negatively skewed, which is a typical feature of this strategies. The positive performance over the stressed periods on short volatility strategies is seen as a compensation to bear the skewness risk of these strategies.

The relative value vol funds have insignificant skewness by combining short and long exposures to implied volatility, while the long volatility funds can generate positive skewness by maintaining the net long exposure to the implied volatility. The tail risk hedge funds have a strong positive skewness which come however at the expense of extended periods of losses during normal markets.
The trend-following CTAs do not appear to generate significant skewness for monthly returns, however, the skewness of quarterly returns becomes significant. I also point out because we have a limited number of monthly returns – about 200 observations – the sample volatility of the skewness estimate is relatively high of about 0.17.
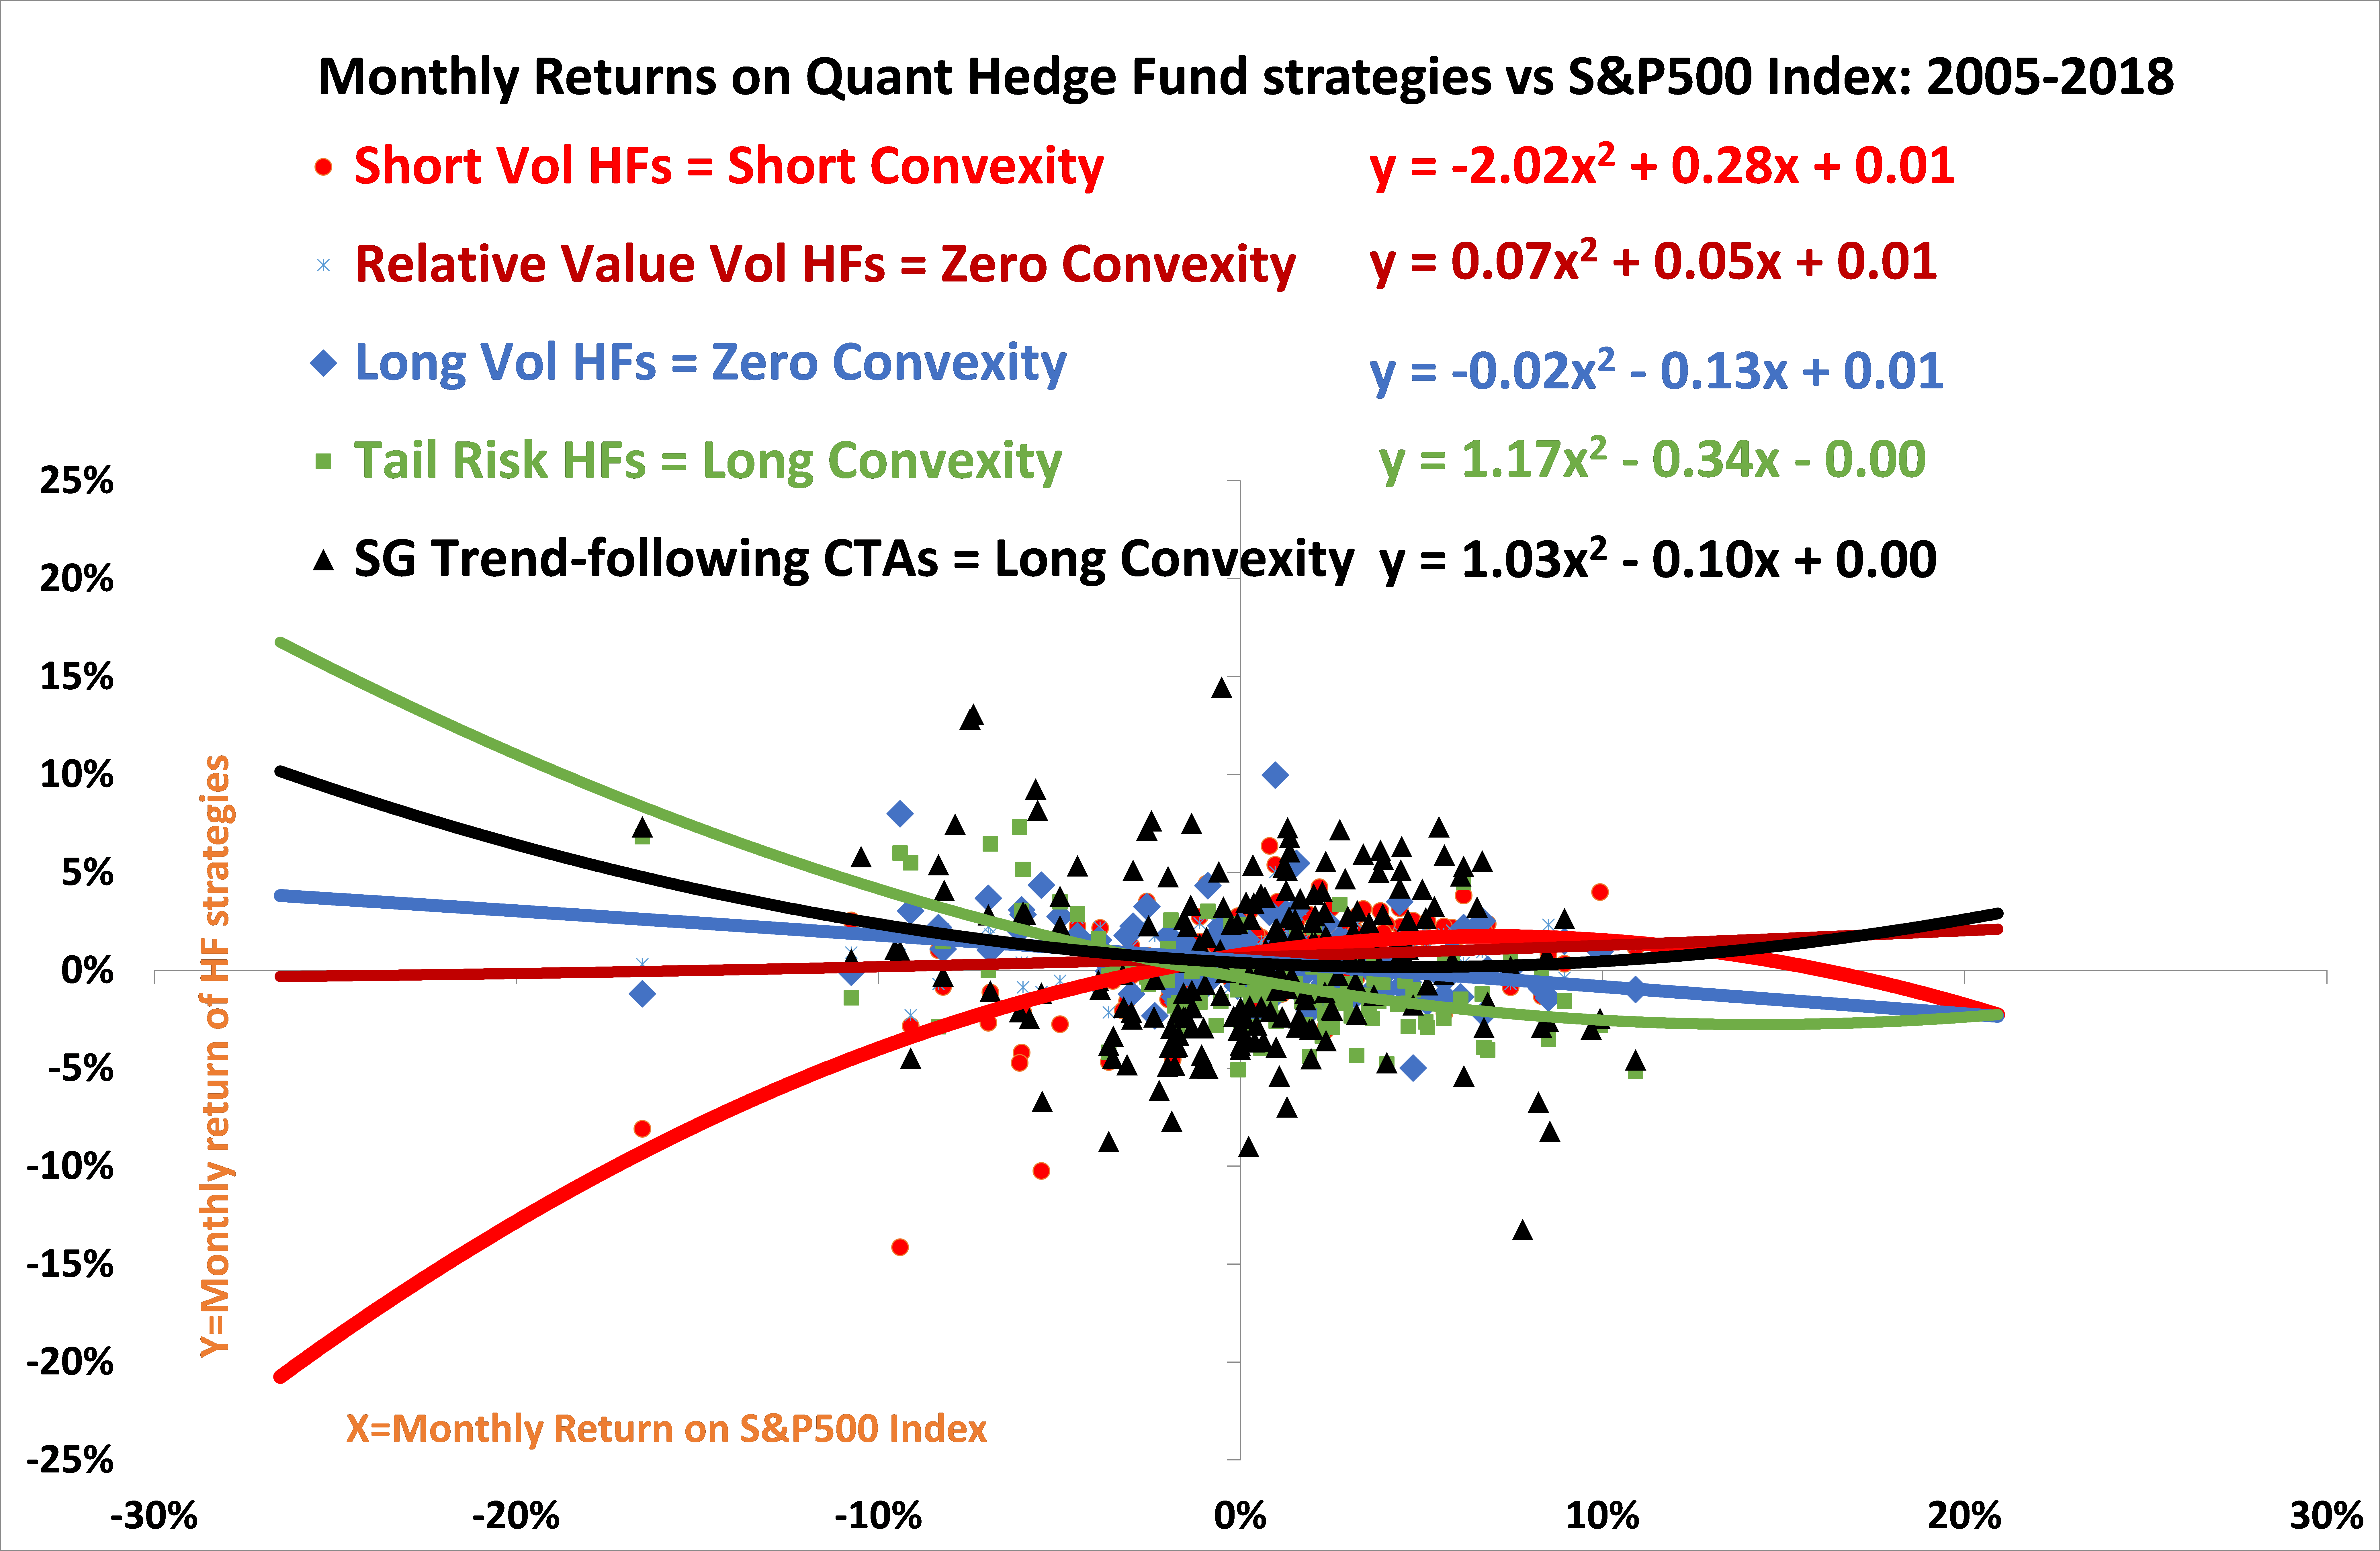
In the figure below, I show the realized convexity with respect to the S&P 500 index using monthly returns. The overall explanatory power of the regression is not strong, only about 10%, However, it provides the indication on the tail risk of quant strategies.

Short volatility HFs generate strong negative convexity losing during stress periods. Relative value and long vol HFs have an insignificant convexity profile. It is instructive that for long Vol HFs, the positive skewness does not produce positive convexity: while the long vol HFs are expected to produce infrequent large gains, the arrival of these gains is not expected to occur in the tail. In contrast tail risk HFs do produce both positive skewness and convexity, however at a cost of negative overall performance which can be seen from their negative alpha. Trend-following CTAs produce significant positive convexity even though they have insignificant positive skewness.
I specifically address the risk profile of trend-following in my recent blog and SSRN article.
Artur will return to QuantMinds International this year. He will be discussing the convexity profile of trend-following strategies.
References
- Artur Sepp (2018) “Trend-following strategies for tail-risk hedging and alpha generation”, SSRN article, https://ssrn.com/abstract=3167787
- Artur Sepp (2017) “Diversifying Cyclicality Risk of Quantitative Investment Strategies”, QuantMinds Buy Side Summit, https://ssrn.com/abstract=2980708
- Artur Sepp (2016) “Volatility Modelling and Trading”, https://ssrn.com/abstract=2810768

