Is your machine learning model biased?

As more and more machine learning algorithms are revealed to contain some form of bias, how could we trust them? A biased model is not an accurate one. Freelance Data Science Educator Parul Pandey shows us the limitations of a biased model and proposes a number of fairness metrics to fix machine learning algorithms.
Machine learning models are being increasingly used to make decisions that affect people’s lives. With this power comes a responsibility to ensure that the model predictions are fair and not discriminating.
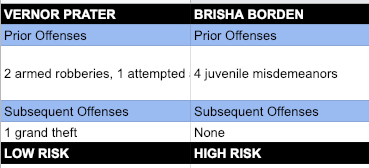
ProPublica, an independent, investigative journalism outfit, came out with an alarming story on May 23, 2016, titled Machine Bias. It highlighted a major bias in the US judicial system citing an example of an 18-year-old girl named Brisha Borden. In 2014, Brisha was arrested for the theft of a bicycle. She was charged with burglary amounting to $80. Just a year ago, 41-year-old Vernon Prater was picked up for shoplifting $86.35 worth of tools from a nearby Home Depot store. Prater was a seasoned offender and had been previously convicted of many thefts and armed robberies in the past. Brisha, on the other hand, had committed some petty offences when she was a juvenile, nothing serious though.
COMPAS which stands for Correctional Offender Management Profiling for Alternative Sanctions is an algorithm used across U.S states to assess a criminal defendant’s likelihood of becoming a recidivist – a term used to describe criminals who re-offends. According to COMPAS scores, Borden – who is black – was rated at higher risk. Prater – who is white – was rated at low risk.
Two years later, Borden had not been charged with any new crime while Prater is serving an 8-year prison term for another offence. Did the algorithm get it all wrong?
The ProPublica VS COMPAS Controversy
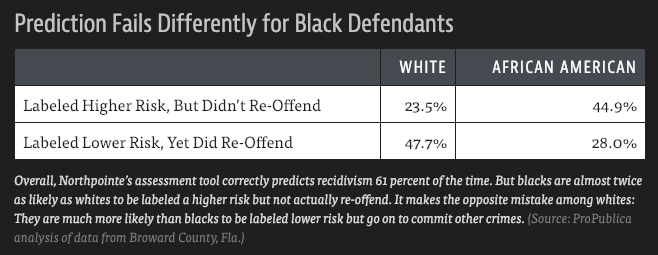
ProPublica’s analysis of the COMPAS tool found that black defendants were far more likely than white defendants to be incorrectly judged to be at a higher risk of recidivism, while white defendants were more likely than black defendants to be incorrectly flagged at low risk.
Northpointe, the company behind the tool responded by saying that the model was not unfair because it had several similar overall performances for both white people and black people. To prove this, they looked at the AUC scores.
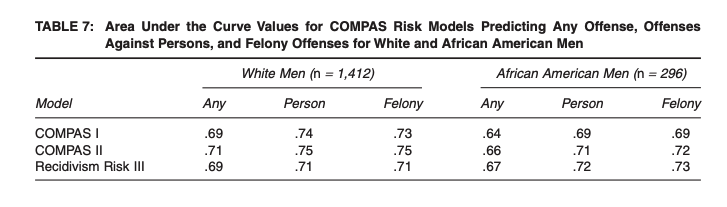
The table above presents the results from each model for the outcomes of any arrest for African American and White men. The AUCs for African American men range from .64 to .73 while for the whites, it ranges from .69 to .75. Northpointe hence concluded that since the AUC results for White men are quite similar to the results for African American men, their algorithm is completely fair.
This leaves us with a very important question: How do we decide which measure of fairness is appropriate? Before answering that let’s learn a bit about how the models get biased in the first place.
Bias in Machine Learning Models
Wikipedia states, “…bias is an error from erroneous assumptions in the learning algorithm. High bias can cause an algorithm to miss the relevant relations between features and target outputs”.
Today, machine learning models are being employed in almost every field. They have the capacity to decide whether a person is entitled to a home loan or not, what kind of movies or news one would be interested in, what is a person’s likelihood of responding to an advertisement and so on. Machine learning models have also made their foray into the criminal justice field and are being used to decide how long an offender stays in jail waiting for parole. But how do we go about making sure that these models are not biased and aren’t unfairly discriminating against people?
Let us consider three different situations.
CASE 1: Different groups having different ground truth positive rates
Consider the following U.S. Breast Cancer Statistics:
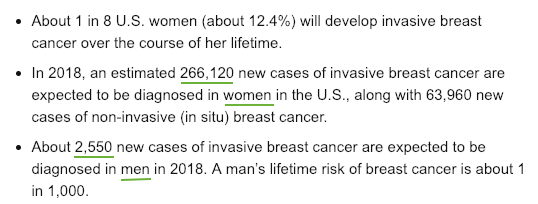
Now, if we were to build a classifier to predict the occurrence of breast cancer according to these statistics, women will get breast cancer about two orders of magnitude more frequently than men do and the ratio of probability will be something like 12% vs. 0.1 %. So, in this case, there are very legitimate differences in the ground truth positive rates between the different genders which will impact the result of the classifier.
CASE 2: The data is a biased representation of ground truth
Datasets can contain label bias when a protected attribute (something like gender, race, age) are assigned within the data set. Let’s see how?
In 2011, a paper was released which reviewed the documented patterns of office discipline referrals in 364 elementary and middle schools in the US. The authors found that:
“Descriptive and logistic regression analyses indicate that students from African American families are 2.19 (elementary) to 3.78 (middle) times as likely to be referred to the office for problem behaviour as their White peers. In addition, the results indicate that students from African American and Latino families are more likely than their White peers to receive expulsion or out of school suspension as consequences for the same or similar problem behaviour.”
So if we have a data set like this and we set out to build a classification model that predicts whether a student will have a behaviour problem in future and uses ‘has been suspended’ for its label then we’re operating with label bias because different groups are getting assigned labels differently within the model and it’s not an accurate reflection of actual student problem behaviour.
CASE 3: When the consequence of the model’s prediction matters.
If we are making a model that is punitive, the consequences of the model’s decisions will be negative, which may be like handing out punishment to somebody. In such a case, one might make a case for caring more about false positives to avoid punishing the innocent based on the output of the model.
On the other hand, when a model is assistive, the consequences of the model’s decisions will be positive, we would be more concerned about false negatives so that we don’t waste our resource or resources on people who don’t need the benefit that we’re handing out.
We need to carefully think about the consequences of our model that can inform what kind of errors matter to us. Biases can get introduced into our datasets easily and we need to pick the appropriate fairness metric to tackle different situations.
Picking the appropriate ‘FAIRNESS’ metrics
It appears that there are certain fairness metrics but then, how do we decide which measure of fairness is appropriate in a particular case? How should we define fairness in the context of the model that we’re building or the problem that we’re working on? Well, a lot of fairness metrics are being employed today to make sure that the resulting model is not biased but unfortunately, they have their limitations.
1. Disparate Impact
This metric is also sometimes called ‘statistical parity’. In U.S. law, unintentional bias is encoded via disparate impact, which occurs when a selection process has widely different outcomes for different groups, even as it appears to be neutral. This legal determination hinges on a definition of a protected class (ethnicity, gender, religious practice) and an explicit description of the process.
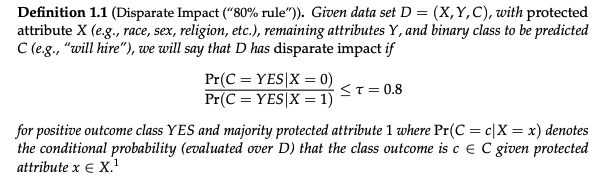
In other words, we take the probability of a positive classification for both groups and then take their ratio. Let’s understand this metric with the help of an example where we need to decide if there is a disparate impact during hiring in a company.
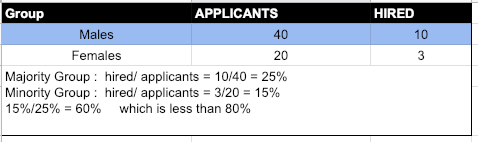
Since 60% is less than 80%, hence there is Disparate Impact
Trade-Off: As we can see this metric implies that the ground truth positive rates would have to be the same. However, this metric of fairness is going to fall flat in CASE 1 discussed above, since there are two orders of magnitude difference between the ground truth positive rates between the different genders.
2. Equal Opportunity
This is another popular metric which compares the true positive rates between protected groups. It is a criterion for discrimination against a specified sensitive attribute in supervised learning, where the goal is to predict some target based on available features. An excerpt from the paper defining equal opportunity:
In the binary case, we often think of the outcome Y = 1 as the “advantaged” outcome, such as “not defaulting on a loan”, “admission to a college” or “receiving a promotion”. A possible relaxation of equalized odds is to require non-discrimination only within the “advantaged” outcome group. That is, to require that people who pay back their loan, have an equal opportunity of getting the loan in the first place (without specifying any requirement for those that will ultimately default). This leads to a relaxation of our notion that we call “equal opportunity”.

Trade-Off: Again this metric doesn’t help to address the situation in CASE 2. where there is a high chance of the dataset containing label bias. The ‘Equal Opportunity’ metric is based on the agreement with the labels and if the labels themselves are biased then we’re not actually addressing the fairness question.
Models are not just mere ‘math’
What we gather from the discussion above is that ‘Bias’ and ‘Fairness’ of models have underlying ethical implications and so we still need some human judgment to make an appropriate decision about how we define and measure fairness in our context.
When machine learning models first started being used to make decisions, people assumed that since they relied on math and computation, they ought to be fair. But we know with the examples above how that myth has been debunked. Now people say, “Adding this constraint will make my model fair” which is still not true. We can’t just rely on the math, we still need a human person applying human judgements.
What is the Solution?
It is not easy to detect bias in real-world data and there is no one-size fits all solution. Civis Analytics, a Data Science and Analytics company, conducted a case study which examines the ability of six different fairness metrics to detect unfair bias in predictions generated by models trained on datasets containing known, artificial bias. One of their findings was, “When evaluating fairness in machine learning settings, practitioners must carefully consider both the imbalances which may be present in the ground truth they hope to model and the origins of the bias in the datasets they will use to create those models”.
Some of the best practices that can be employed when building a machine learning model are:
- Thinking about the inputs and the outputs of the model.
- The available Fairness metrics can help up to a limit. It is for us to use them wisely.
- Use a diverse team to create models
- Always study the data, its sources and also check the predictions.
- There are methods which can be employed while training the model to make it fair but one should be clear about the meaning and context of the term ‘fair’. Some of these methods are:
- Evaluating fairness metrics in the presence of dataset bias, Hinnefeld et al.
- Certifying and removing disparate impact, Feldman et al.
- Fairness without demographics in repeated loss minimization, Hashimoto et al.
Conclusion
Machine learning has proved its mettle in a lot of applications and areas. However, one of the key hurdles for industrial applications of machine learning models is to determine whether the raw input data used to train the model contains discriminatory bias or not. This is an important question and may have ethical and moral implications. However, there isn’t one single solution to this. For cases where the output of a model affects the people, it is wise to put fairness ahead of profits.
Reference
This article was inspired by the wonderful talk titled ‘Measuring Model Fairness’ given by J. Henry Hinnefeld of Civis Analytics. A big thanks to him for highlighting such an important aspect of AI and machine learning.