Microstructure and information flows between crypto asset spot and derivative markets

Professor of Finance at the University of Sussex Business School and leader of the Quantitative Finance and Fintech research group, Carol Alexander is presenting some path-breaking results at QuantMinds International 2020 – starting with the complex task of analysing price discovery among the hundreds of crypto spot and derivatives platforms which, for the past year, have had an average aggregate monthly trading volume of well over $500 billion.[1]
Which crypto instrument on which exchange is the first to incorporate new information? Where are the most informed traders located? How long do traders on other platforms have to profit from the leaders' reaction to news?
Since the 1980s, a massive amount of academic research on these questions aims to provide informational advantages to high-frequency traders. They are relatively easy to answer for traditional assets like financial futures/ETFs, gold, fiat currencies, energy and commodities. Compared with crypto, the trading is slower, the volatility lower, and there are only a few instrument-types in each asset class, typically traded on just one venue.
However, bitcoin and other cryptographic coins and tokens form a new class of financial asset with some very novel and interesting properties, including the market microstructure. They may be traded 24/7 and 365 days per year, either ‘off-chain’ on hundreds of different centralised exchanges or transferred directly ‘on chain’ using smart contracts on the Ethereum chain or other public blockchains via peer-to-peer (P2P) trading venues called decentralised exchanges.
Few of these venues are regulated, yet a wealth of limit order and transaction data are freely available, providing a level of transparency that is quite unique. As a result, crypto assets and their derivatives have become the ideal testing ground for studying market microstructure and price discovery, all the way from leader identification to optimal trade execution based on machine-learning algorithms.
About the data. For decentralised exchanges, block explorers give details of each transaction in every block, pseudo-anonymised with hexadecimal numbers representing wallet addresses in the P2P network. For centralised exchanges, although nothing is recorded on the chain,[2] there is even more data. A wealth of free VWAP coin price and cap-weighted crypto market indices are freely available, although some are better quality than others.[3]
Also, most platforms have an API which allows order book data to be downloaded directly at very high frequency. Data and software provider CoinAPI links with hundreds of crypto spot and derivatives exchanges, offering historical and streaming order book and trades in tick-by-tick or highest granularity data from all major centralised (and decentralised) exchanges.
Information share metrics for price discovery are derived from N-dimensional vector error correction models (VECMs) based on very high-frequency time series. Each day, my PhD student Daniel Heck has calibrated such a model to N different minute-by-minute returns and then calculated the metrics for each market on that day. The sum of the N individual information metrics is 1 and the higher the metric for a particular market, the more influential its price discovery role on that day. Then we roll forward 24 hours and repeat, getting a picture of the influence that different markets have on ‘discovering’ the common efficient bitcoin price, and how this leadership evolves over a period of time.
Here I’ll focus on the metric called the ‘generalised information share’ (GIS). I’ll be discussing the latest results for a selection of VECMs during the first part of my talk at QuantMinds. But in this article I’ll present just two VECMs, with N = 2 and 8 respectively: The first is for the regulated ‘institutional’ bitcoin futures exchanges (N = 2, with CME and Bakkt); and the other (with N = 8) is for all the most influential instruments from the unregulated bitcoin spot and derivatives exchanges, and the CME. The figures below summarise our results.
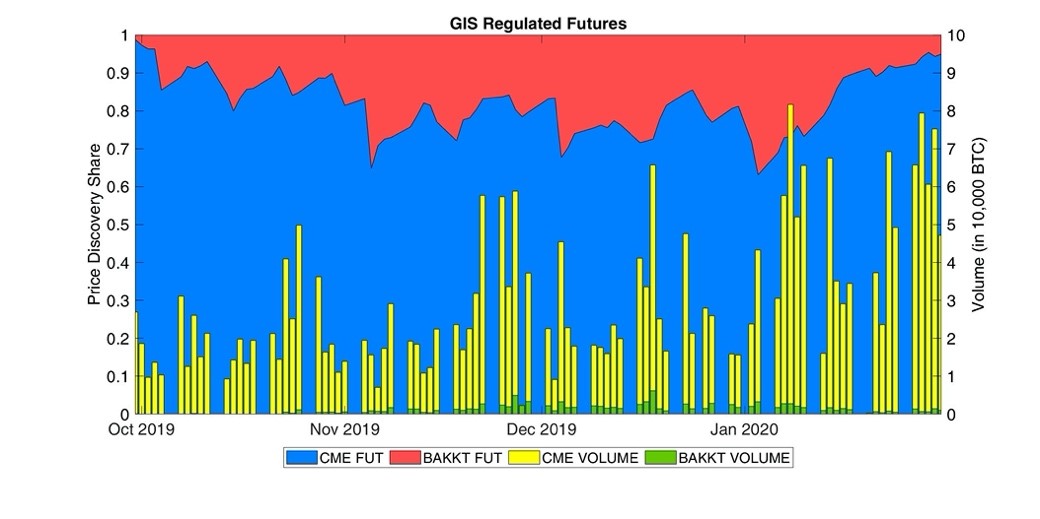
Figure 1: Generalised Information Shares and Volumes: CME and Bakkt Bitcoin Futures

Bakkt, a subsidiary of ICE, eventually launched their (physically-settled) bitcoin futures in September 2019, after considerable media coverage. However, after an initial surge of interest, they have (as yet) failed to capture market share from the CME. In January 2020 the ADV on Bakkt futures was only $12 million, compared with $450 million on CME futures. So, it is not surprising that about 95% of new information – on institutional bitcoin platforms – is led by traders on the CME.
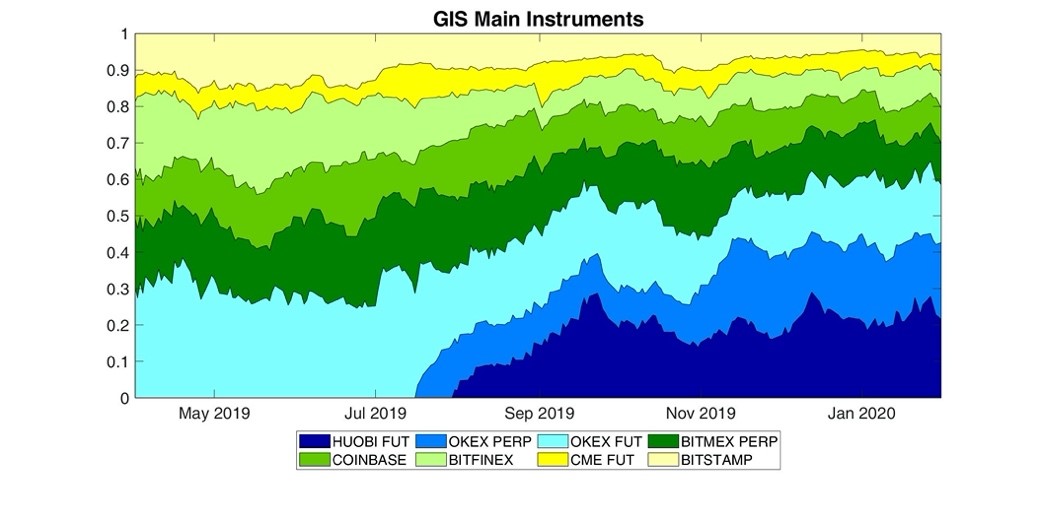
However, the vast majority of off-chain bitcoin trading is on unregulated exchanges. In fact, since its inception in 2017 and until very recently, the BitMEX perpetual swap was by far the strongest leader of bitcoin price discovery.[4] But during the last 12 months the situation has changed. To see this, consider Figure 2, which depicts the GIS for an 8-dimensional VECM. These 8 bitcoin spot and derivatives markets are colour coded and ordered by their final GIS on 31 January 2020.
Figure 2: Generalised Information Shares for Bitcoin Perpetual Swaps, Futures and Spot

First, it is evident that the CME futures (shown in yellow) only account for about 6% of total bitcoin price discovery in this system. And even though the Huobi exchange didn’t introduce their (quarterly) futures until 2019, this contract has recently become the overall price leader. Its GIS (shown in dark blue in Figure 2) has rapidly grown to take the major share, standing at over 20% on 31 Jan 2020. And its trading volume is second only to the BitMEX perpetual swap (ADV: $2.8 billion on Huobi futures vs $3.2 billion on BitMEX perpetual swap). To put these volume figures in context, for the three spot markets shown in Figure 2 (Coinbase, Bitfinex, and Bitstamp) the ADV in total is only $200 million.
But of all the platforms considered here, OKEx is perhaps the most interesting. By the end of January 2020 their quarterly futures (light blue) and perpetual swap (mid blue) together accounted for over one-third of bitcoin price discovery. Yet, with an ADV of about $1.5 billion – $1.1 billion on the futures and $400m on the perpetual – they have less than one-sixth of the trading volume.
Huobi and OKEx attract better-informed players in bitcoin markets. Located in Singapore and Hong Kong respectively, most institutions are not allowed to trade on these exchanges. Nevertheless, they can look into their order book for high-frequency trading signals. For instance, if you trade on Coinbase (or CME, or Bitstamp, etc.) how many minutes do you have to profit from following a large upward or downward price jump on the OKEx perpetual? How long do you have following a similar move in Huobi futures? I’ll be discussing these results during my talk. Hope to see you there.