Small but mighty: The PE mid-market opportunity

The mid-market private equity sector may be defined by smaller transactions, but its impact is anything but small. In fact, this segment dominates the private equity landscape, accounting for an impressive 96% of all buyout deals across the US and Europe between 2014 and 2024. With attractive valuations, lower leverage ratios, and unparalleled growth potential, mid-market buyouts offer investors a wealth of opportunities to unlock value and drive performance. Ahead of SuperReturn Europe (formerly SuperInvestor), Imogen Richards, Partner and Head of Primaries, Pantheon, dives deeper.
Although the mid-market private equity sector may by its very definition be made up of smaller transactions, it is far bigger than its large-cap counterpart, with some jumbo-sized attractions to match.
Certainly, the mid-market is not a niche part of this growing industry (1). Between 2014 and 2024, around 96% of all buyout private equity deals across the US and Europe happened in the mid-market (2) , meaning there is a huge opportunity set for investors to tap into in this segment of the market.
The mid-market also offers some of the most interesting terms of all private equity deals seen globally, not least the potential for more attractive valuations. Indeed, between 2009 and 2024, while large- and mega-cap buyout funds saw median enterprise values to EBITDA multiples averaging 11.4x, small- and mid-cap buyout funds averaged 9.6x (3). The leverage ratio on small- and mid-cap transactions is also smaller than larger deals, averaging 3.9x compared to 5.7x for large and mega buyout funds over the same 2009–2024 period (4).
As mid-market buyouts are more likely to be the first instance in which founder-led companies are offered institutional capital, we believe that there are a greater number of value creation levers that can be pulled over the tenor of sponsors’ ownership, meaning there are more opportunities to improve an asset’s operating performance. Similarly, smaller assets are, of course, most likely to have the greatest potential for growth.
For mid-cap firms, the average change in revenue from a sponsor’s entry to exit is around 116%, 2.7x times higher than seen for large-cap firms. Similarly, the average change in EBITDA from entry to exit is 126% for mid-cap companies, 3.6x higher than for large-cap assets.
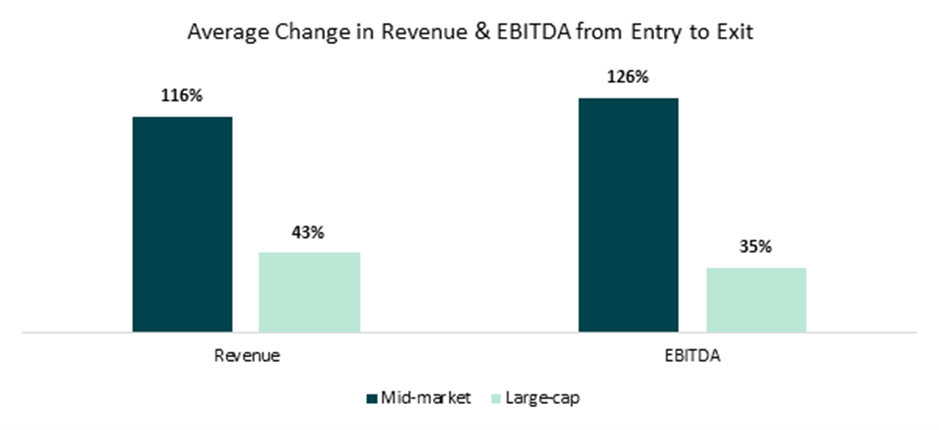 Source: Morgan Stanley – The Case for the Middle Market Private Equity Investing (May 2025).
We also see greater potential for enhanced exit optionality in this part of the market, with mid-cap assets more likely to be sold to strategic buyers than to be divested via the potentially volatile IPO market than large-cap names.
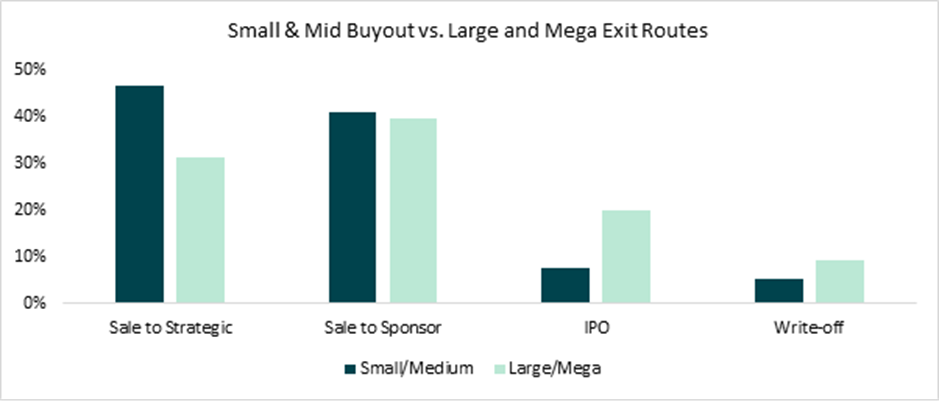 Source: Pantheon internal data and analysis as of December 31, 2023. Analysis derived from data sourced from Pantheon portfolio GPs and includes 856 underlying company realizations over the period 2009–2023 out of a total sample size of 2,343 companies over the period. Analysis includes buyout exits based on Pantheon’s internal classification.
These factors result in stronger top-down performance statistics, and between 2006 and 2021 the median net internal rate of return for mid-market PE funds stood at 14%, compared to 12.9% for large-cap funds. However, this same data set also shows that the rate dispersion of returns is higher for mid-market funds. Over the same period, the interquartile range is around 300 basis points wider for mid-market funds compared to large-cap funds, while during the volatility of the global financial crisis it was around 650 basis points wider.
This highlights the importance of accessing the top-tier funds; as well as the potential for outperformance, underperformance is also a real possibility.
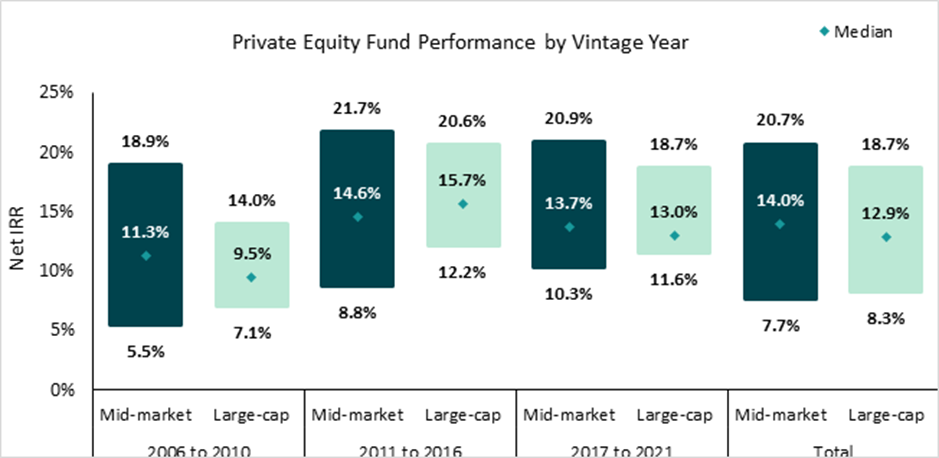 Source: Preqin. Fund performance data accessed on April 16, 2025, using the most recent reported data. Includes fund vintages 2001–2021. Size classification by Fund Size (Mid-market: under $5B; Large-cap: over $5B).
All about relationships
Although the private equity mid-market may be vast, it can be difficult to identify the best mid-market funds as there are so many operating in this space, and once you know who you want to invest with, accessing their funds may be difficult because the funds are small and they will likely already have an established LP base. The sponsors in this segment of the market are likely to be sector or regional specialists, and relationships matter if you want to access and transact alongside the best managers with the deepest industry knowledge and capabilities. This, of course, is attractive in itself – given the sponsors worked with are more likely to have deep, experienced insights into their sector – but it does mean that long-term and deep relationships become ever more important to investors. GPs value investors who can provide them with a full suite of solutions from blind pool capital to co-investment capabilities as well as secondary experience for CVs.
Scaling up
One of the key questions we get from investors is how it’s possible to scale returns in the mid-market, without changing strategy to focus on larger deals over time. In our view, the differentiated benefits of the mid-market space are attractive enough to maintain our focus on the smaller end of the market, so if we do not turn to large-cap transactions we look to go deeper into the mid-market instead.
This is not just about adding more sponsors to invest alongside our roster – although this is an option – but also about building out our relationships with our existing sponsors, to ultimately become genuine strategic partners. Here, we not only leverage our existing expertise and relationships, but also tap into the depth of those relationships and our status as an early backer on many deals to ensure that we are operating from a position of strength with our sponsor partners to boost our allocations with managers from the access-constrained mid-market.
Investor appetite for mid-market private equity is growing, with dry powder in this sector close to record levels at $787 billion as of September 2024 . But we believe that it is the investors with strong existing relationship across the segment and a long, deep expertise of the market that will be best placed to access the value on offer in this small but mighty asset class.
Appendix
(1) Pantheon defines the mid-market as small or medium buyout, with key operating metrics including revenue up to $1 billion, EBITDA up to $150 million, and EV up to $2.5 billion.
(2) Source: Pitchbook, May 12, 2025.
(3) According to Pantheon internal data and analysis as of December 31, 2024. Analysis derived from underlying company data from 3,723 companies, where EV/EBITDA data is available. Analysis includes small and medium buyout based on Pantheon internal classification.
(4) As above.