Most discussions around cryptocurrenciers gernally focus on the underlying value of the "coins" being purchased and how the technology will advance and can be put to good use, but many will have also seen that the prices for these currencies is also extremely volatile. Here, Anton Golub, Co-founder and Chief Science Officer at Lykke Corp and Vladimir Petrov, Department of Banking and Finance, University of Zurich, discuss Bitcoin's seasonal volatility.
A wide range of research papers in the area of cryptocurrencies blossomed in the past few years due to the growing interest in the blockchain technology and to the various attempts of employing it to the real world problems. Most of the debates have been centred around the question what is the real underlying value of Bitcoin and other alternative coins (altcoins) as well as the current and the future adoption of the technology for the general use. Despite the great diversity of standpoints on whether we are dealing with something well-known (and just experience regeneration of finance) or in fact witnessing a completely new phenomenon, one matter is absolutely clear: cryptocurrencies as digital assets build on top of blockchain have already grown out of their embryo phase and are here to stay as an independent asset class. Therefore, in order to be ready for the further expansion of this newborn but furiously growing technology, it is crucial to be aware of cryptocurrency' properties and their stylised facts.
At the end of 2013, the price of Bitcoin increased about 10 times within three months and reached the level of $1'500. It did not take a long time until it crashed about 50% towards $500 per bitcoin. Even more mind{blowing was the rapid growth in 2017 which this time broke the 20x level and went beyond $20'000 followed by already familiar fall of nearly 70% two months later. Such extraordinary price moves could appear due to the fact that in contrast to the traditional markets the crypto space is still facing lack of wide streams of the cash ow and the constant monitoring by a large set of big financial institutions together with governments and regulators.
In contrast to the traditional markets, transactions in crypto space happen 24 hours a day and 7 days a week. Moreover, until the very recently cryptocurrencies were barely of interest to professional traders and large financial institutions. These two facts suggest that there are could be serious differences in the seasonality patterns typical for the foreign exchange market (for example, Dacorogna et al. (1993)) and the ones observed in the Bitcoin trades. Haferkorn and Diaz (2014) analysed seasonality patterns of the number of payments in three crypto-currencies: Bitcoin (worldwide payment system), Litecoin (open source software project), and Namecoin (decentralized name system). This research confirmed that in contrast to the traditional equity and FX markets, the monthly or yearly seasonality was not revealed. Only Bitcoin unveiled a strong weekly pattern while Litecoin and Namecoin had a weak or no pattern. Moreover, the authors state there is no significant correlation between the observed exchange rates. Authors speculate that the reason of this is in the fact that although all these cryptocurrencies have similar architecture they have been created with quite specific predestination.
JE de Vries and Aalborg (2017) made another attempt to discover seasonality patterns of Bitcoin prices, analysing the daily traded volume, the daily transaction volume and Google trends (which reflect the number of searches for the word "bitcoin"). Additionally, the author inspected seasonality in the unique account addresses used to complete transactions. All of the measurements demonstrated no particular periodicity. An in-depth exploration of the intraday scale described in the seminal work Eross et al. (2017) gave more affirmative answer on the existence of intraday seasonality of Bitcoin prices. They investigated Bitcoin returns, volume, realized volatility and bid-ask spreads to reveal several intraday stylized facts. Significant negative relationship was found between returns and volatility, while volume and volatility have a considerably positive correlation. The authors attribute such patterns to the European and North American traders as well as to the lack of market makers in the whole crypto space.
To extend the set of existing literature on this attractive topic we analysed weekly volatility seasonality of Bitcoin prices from 2014 to 2018 using the highest resolution data: tick-by-tick prices. We selected a novel approach which does not simply compute realized volatility using the sum of squared returns, but operates in the directional-change intrinsic time. The intrinsic time dissects the time series based on market events where the direction of the trend alternates. These directional change events are identified by price reversals of a given threshold value set ex-ante. Once a directional change event is confirmed an overshoot event begins and continues the trend identified by the directional changes. An overshoot event ends when the opposite directional change occurs. With each directional change event, the intrinsic time ticks one unit (Glattfelder et al. (2011)).
To understand what are the prime contributors to the phenomenal price activity in the crypto markets Sapuric and Kokkinaki (2014) analyzed volatility of Bitcoin returns within 4-years long time interval. They confi rmed Bitcoin's high activity, but emphasized that traded volume is an important fact which should be taking into account computing the volatility. They compare Bitcoin with conventional fi nancial instruments, including gold, several national currencies and demonstrate that the calculated volatility signifi cantly decreases when the traded volumes are included in the model.
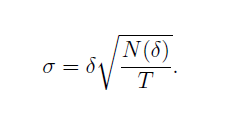
For our analysis we choose a threshold of δ > 0 percent of the data series. The detailed sampling rule is as follows: the initial trend is selected to be upward; all recorded prices one by one collected by the algorithm and the highest price among them is kept in the memory; as soon as the price drops by δ from the highest value, then this is the first intrinsic event and this datapoint should be sampled. The collected set of prices should be discarded and now the prices of the downward trend are collected. The lowest observed data point is kept in memory until the positive move of δ is registered; this is then the second intrinsic time point. The data series thus determines the pace of sampling and generates itself the intrinsic event-based timescale; the method is endogenous of the price. In the traditional literature, one can find that the directional-change intrinsic time actually counts drawups and drawdowns interchangeably following each other. The main feature of the method is in the ability to capture the instantaneous volatility of the process underlying the studied data. The equation 1 demonstrates how the directional change threshold δ and the number of directional changes N(δ) over the time interval T translate into the volatility σ:

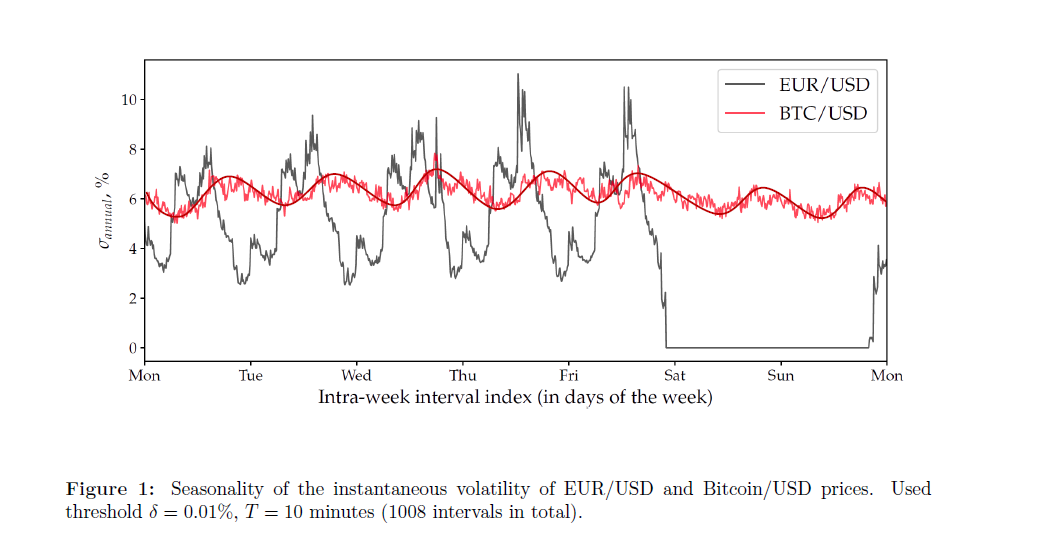
Figure 1 shows weekly volatility seasonality of Bitcoin/USD and EUR/USD. Notably shifted fluctuations, less pronounced intraday activity, and slightly decreased volatility over weekends - these are clear differences which could be seen by the naked eye.

We note that instantaneous volatility of the given directional change threshold exhibits low level. In our extended research, we applied bigger directional change thresholds and noted how the instantaneous volatility increases together with the increased threshold. Moreover, the average volatility of the same exchange rate computed by the "traditional" approach reaches about 40%. This substantial difference could be attributed to the fact that the Bitcoin prices often experience instant jumps or falls which makes the analysed time series very discrete. Such discreteness means that the analysed process is very far from being continuous and that the analytical equation 1 derived using the assumption that the underlying process is a Brownian motion has to be used with some caution. Why is it important to know statistical properties of cryptocurrencies, such as seasonality? The crypto market will evolve much faster than one could imagine. As it was said in the report from European Central Bank
Virtual currency schemes differ from electronic money schemes insofar as the currency being used as the unit of account has no physical counterpart with legal tender status...
Traditional trading techniques and regulation requirements have to be significantly optimised to be ready for all innovations brought by the advanced crypto instruments and to be able to successfully deal with all potential drawbacks of the renovated financial system. Learning the properties of Bitcoin and other cryptocurrencies and confronting them to the properties of traditional markets we can contribute to the transition phase which will bring the whole world to the safe future where the the word "finance" will become a synonym of "democracy".
This project has received funding from the European Union's Horizon 2020 research and innovation programme under the Marie Skłodowska-Curie grant agreement No 675044.
