What drives Bitcoin volatility?

On 12 July our virtual event QuantMinds Edge: Option pricing, trading and volatility will kick off. We will zoom in on how best to use AI, applying advanced technologies and much more. Get a sneak peek at the event here, as Carol Alexander, Professor of Finance and lead of the Quantitative Fintech research group in the Business School at the University of Sussex, shares her research in Bitcoin volatility.
Bitcoin is a purely speculative asset, yet its price is a reflection of the health of the entire crypto asset ecosystem. I write this having just witnessed its fourth major price bubble in ten years – bitcoin is currently trading at less than $20,000, down from an all-time high of over $70,000 in November 2021. This latest crash started with a coordinated attack on the Terra/Luna algorithmic stablecoin in the second week of May, followed by (and rumours say linked to) a credit crisis in the Celsius network. Then the latest event last week was precipitated by the automatic liquidation of some very large bitcoin and ether option positions held by Three Arrows Capital on the Deribit exchange [1]. Three Arrows filed for insolvency after fair-weather friend Deribit (which is by far the largest crypto options exchange by trading volume) demanded repayment of a $80m loan which enabled the hedge fund to take such large positions in the first place [2].
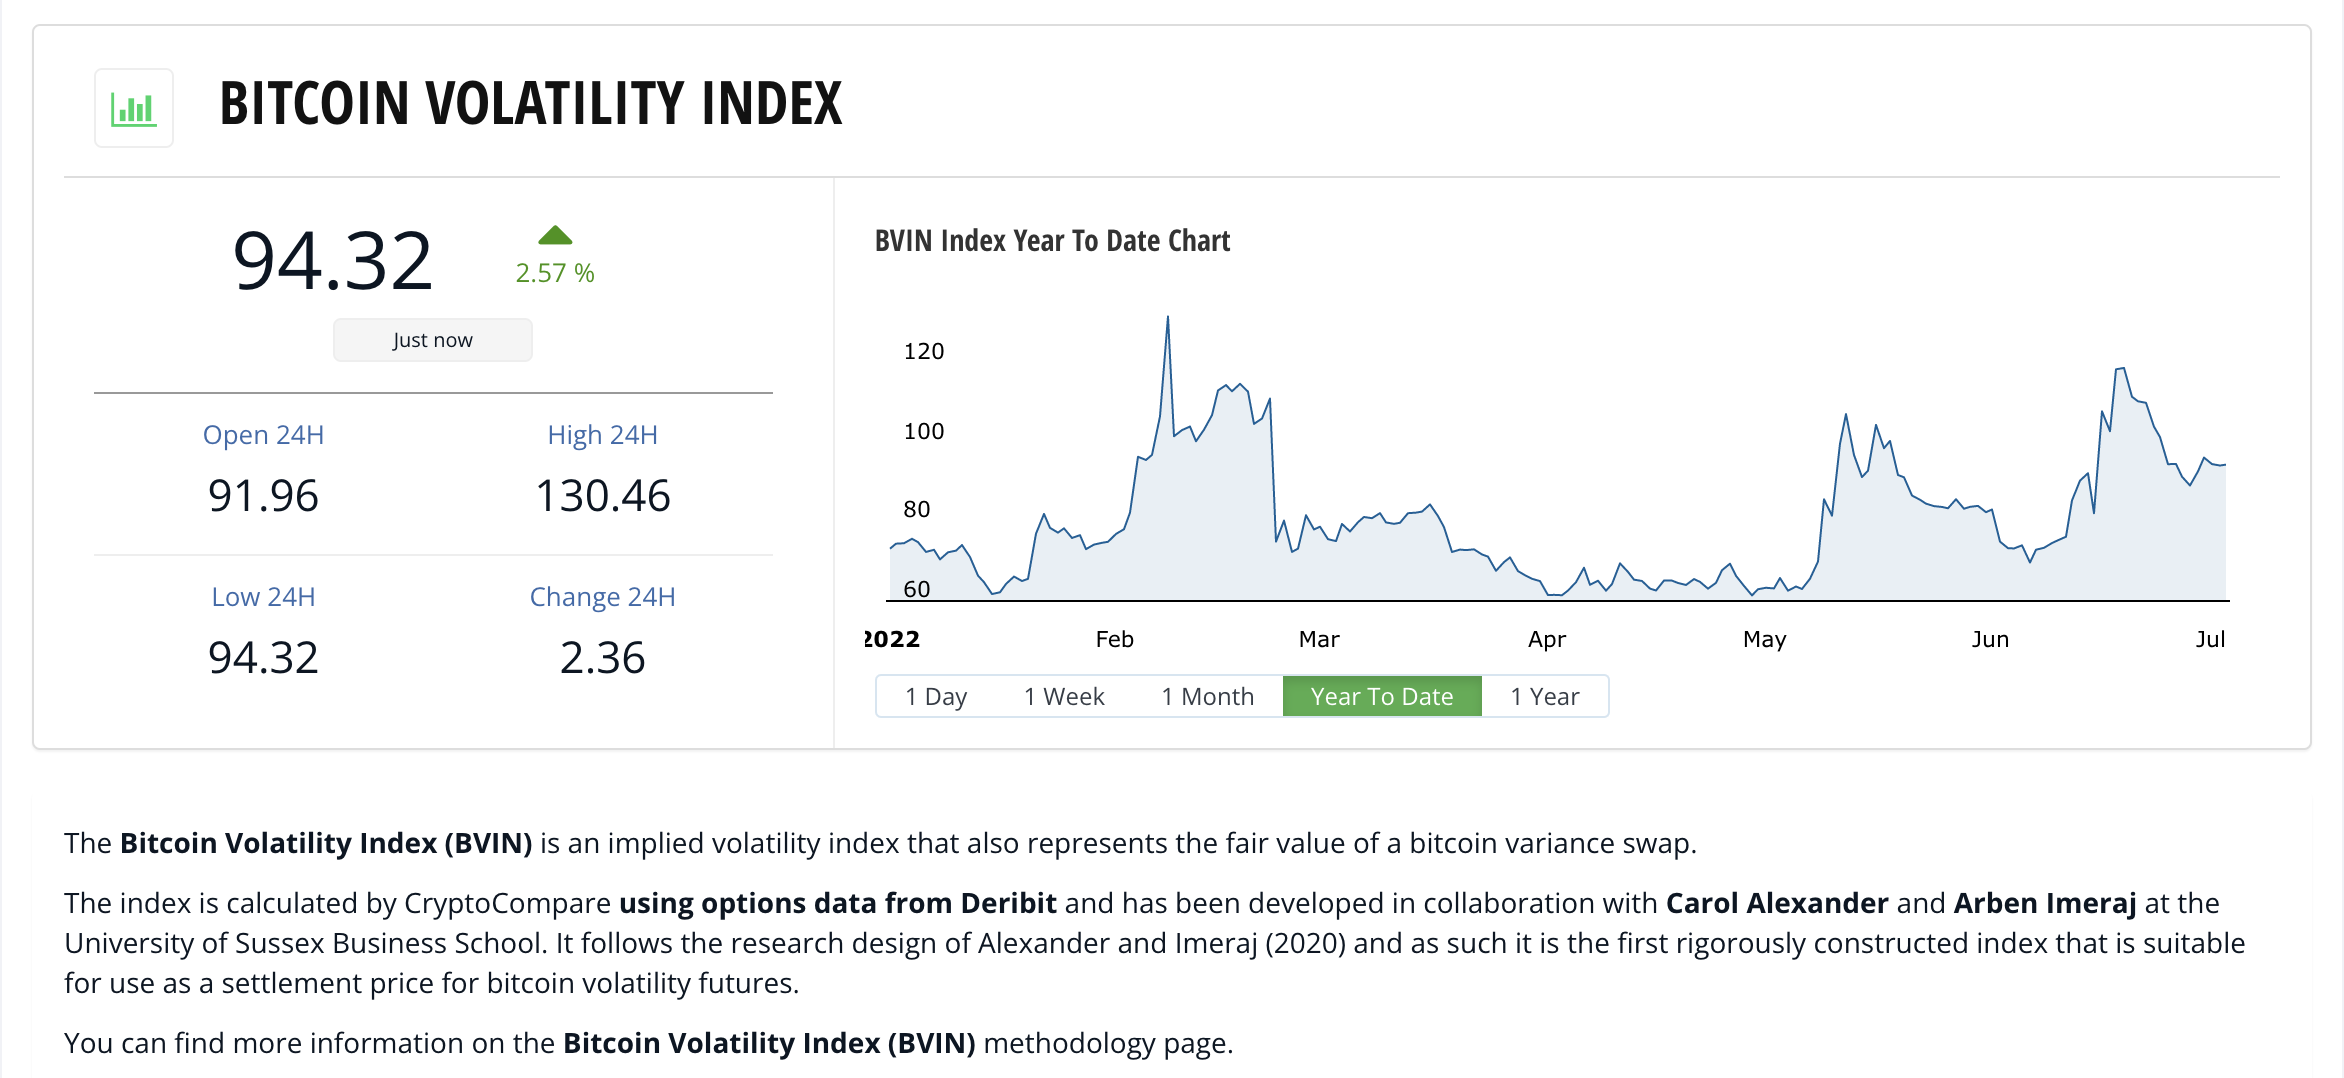
Figure 1: A 30-day Bitcoin Implied Volatility Index
Source: CryptoCompare
At a previous QuantMinds presentation on bitcoin options I examined a family of VIX-type bitcoin implied volatility indices and analysed the determinants of the bitcoin variance risk premium. Based on Alexander and Imeraj (2021) we built the first live-streamed bitcoin implied volatility index (BVIN) which was launched by CryptoCompare in 2020 [3]. The BVIN reached 120% during the June 2022 market crash, close to its 12-month high of 130.46% – see Figure 1. Even through the relatively tranquil periods earlier this year, the index rested at around 60%. To put this in context, the S&P500 VIX also jumped after the recent market turmoil following the FOMC’s rate rise of 75 basis points in June 2022 – but only to 30%.
At QuantMinds Edge I’ll be talking about more recent research on buy and sell sides of the bitcoin options market. Since January this year the total open interest on all bitcoin option contracts has fluctuated between about $5bn and $10bn, with monthly trading volumes between $15bn and $23bn [4]. Over 90% of this activity takes place on Deribit, which is one of several so-called ‘self-regulated’ centralised crypto derivatives exchanges. Originally registered in the Netherlands, in February 2020 the exchange moved to Panama in order to avoid compliance with the European Anti-Money Laundering Directive, 5AMLD [5]. As a result its clients continue to retain anonymity, with identities linked only to their wallet addresses. Also, the exchange is not required to make any report on suspicious activity of any type, including market manipulation. Like numerous other ‘self-regulated’ crypto exchanges, Deribit trades 24/7. As well as European options on bitcoin, it offers similar products on ether, as well as calendar and perpetual futures. But the Deribit futures market is relatively small, indeed their futures are mainly used for delta-hedging their options.
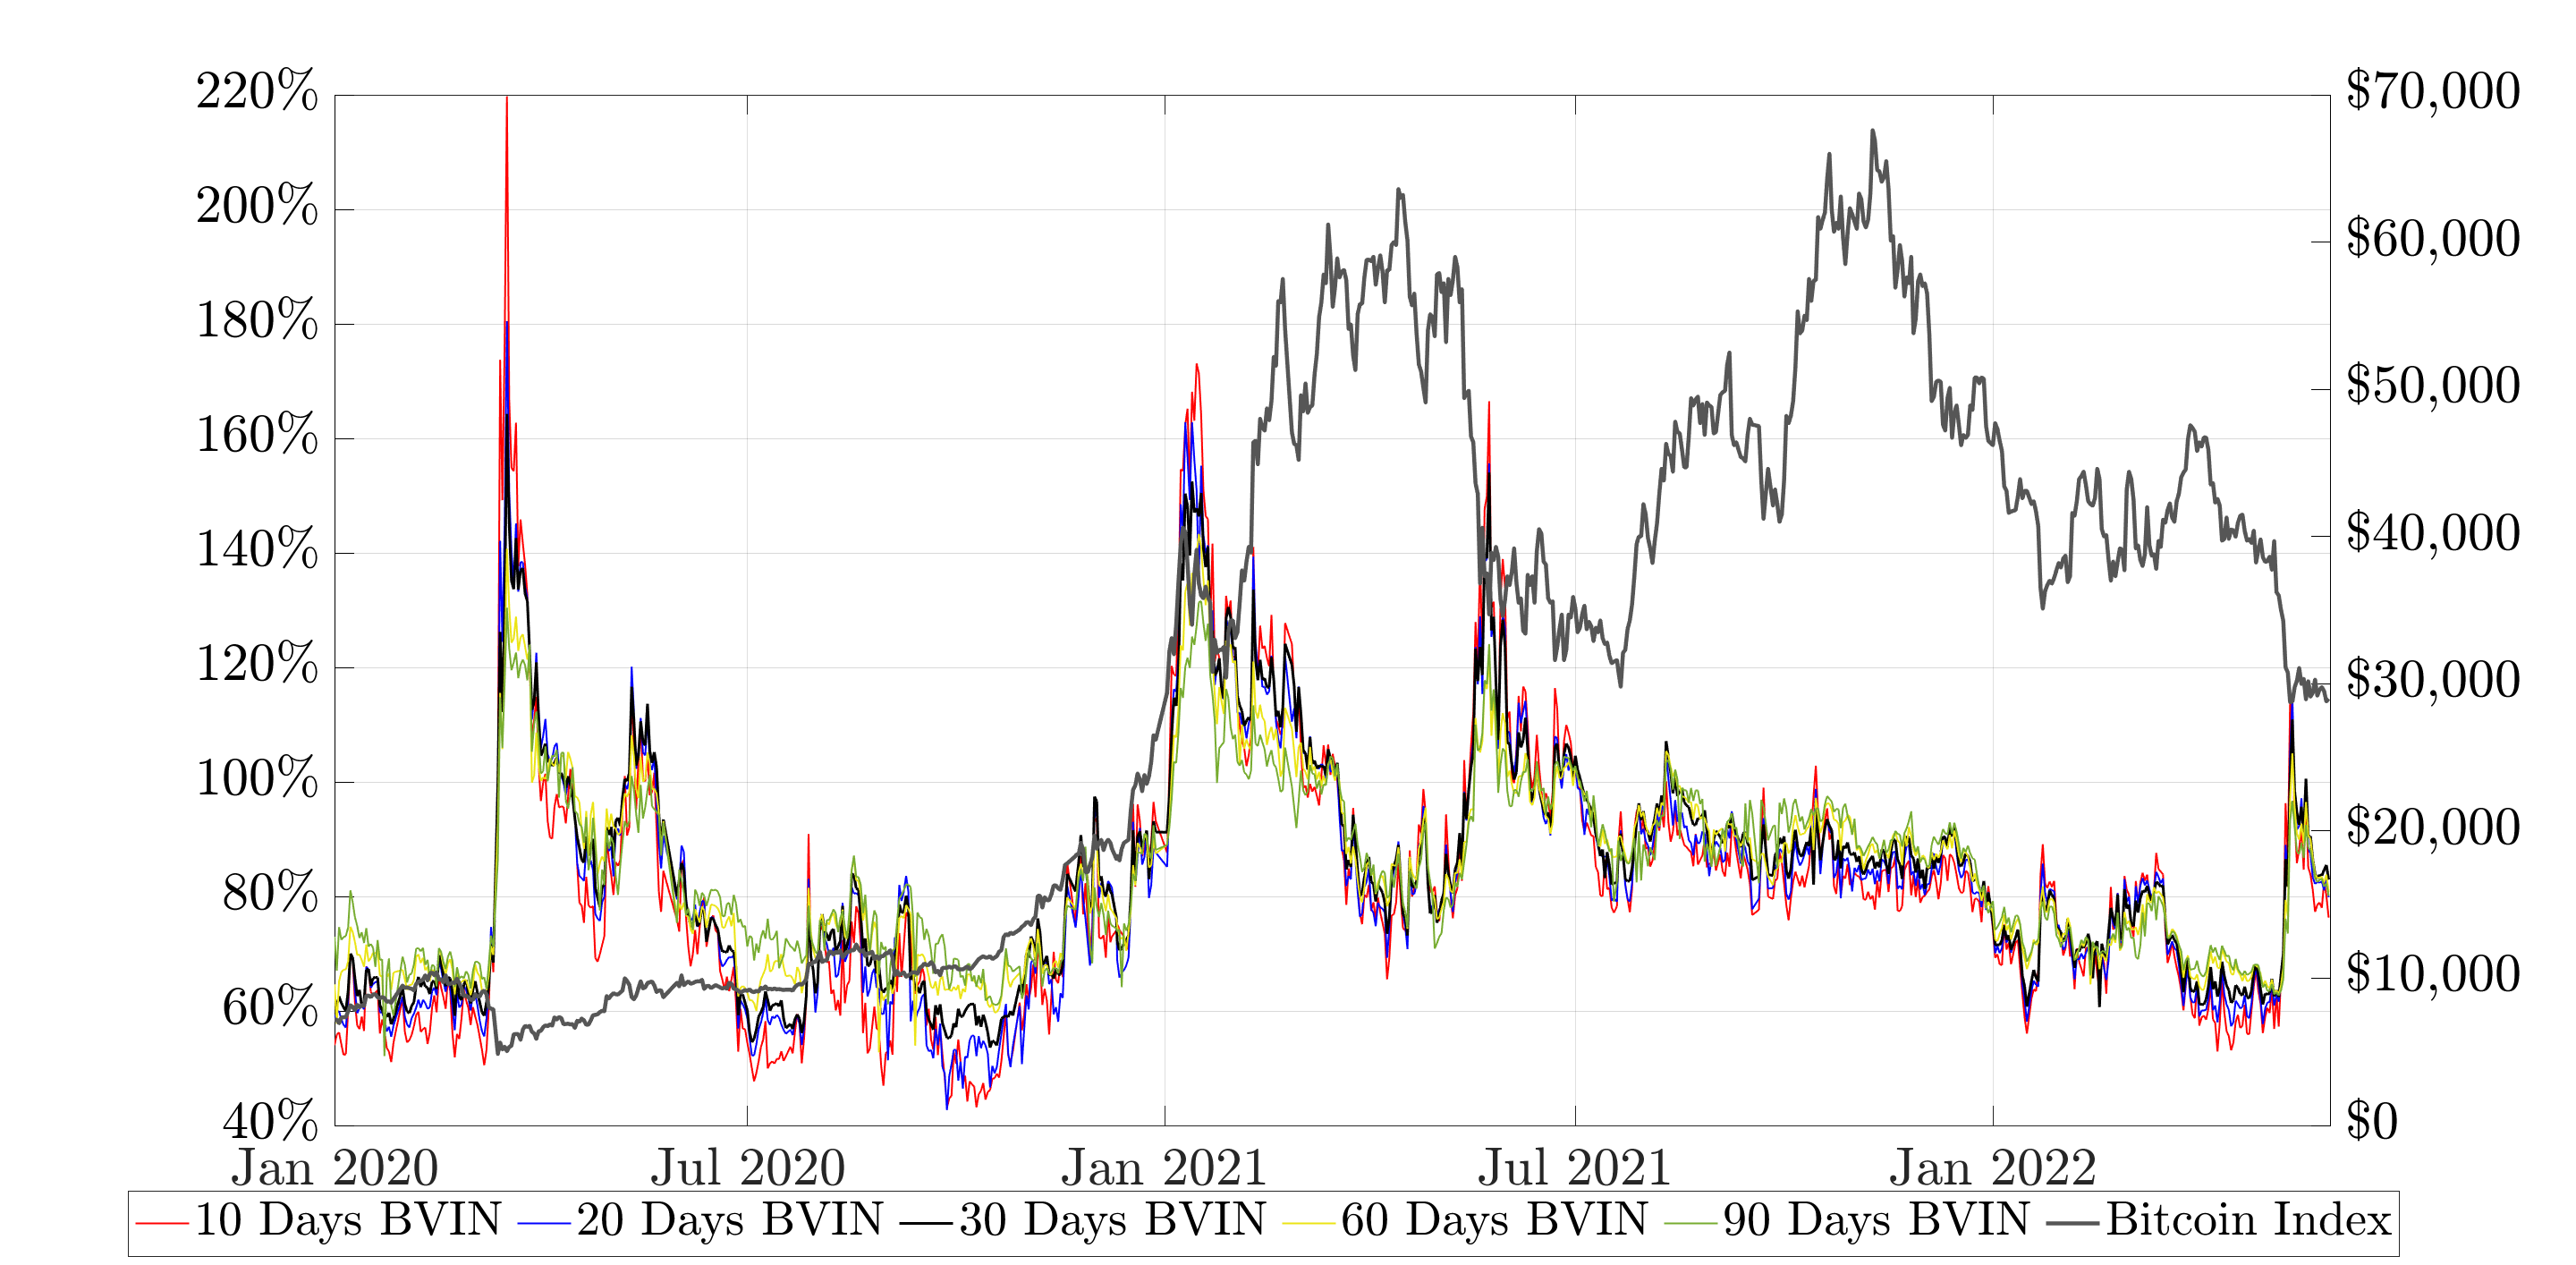
Figure 2: Evolution of a Term Structure of Bitcoin Implied Volatility Indices
The VIX methodology is applied to Deribit bitcoin options, with constant maturities of 10, 20, 30, 60 and 90 days.
Figure 2 depicts the evolution of a term structure of BVIN indices with constant maturities of 10,20, 30, 60 and 90 days. On 13 March 2020 the 10-day BVIN exceeded 200%. This was just after bitcoin spot prices fell over 30% in a few hours during the ‘black Thursday’ crash. At this point in time the term structure was in strong contango, with the 90-day BVIN registering around 125%. The next BVIN peak was not until 2021 and this time it corresponded to upward jumps in the bitcoin price, which rose from about $23,000 on 22 January to over $40,000 on 19 February 2021. Again, quite unlike equity volatility. But the next hike in bitcoin volatility again occurred during a crash. This was on 19 May 2021, when numerous retail investors had their highly-leveraged positions in crypto futures automatically liquidated – a debacle that has resulted in some high-profile class-action law suits.
Given these very different features of implied volatilities we might ask – how well do the findings from the equity option hedging literature translate into bitcoin options? On 12 July I’ll be talking about Alexander and Imeraj (2022), who analyse the robust dynamic delta hedging of bitcoin options using a set of smile-implied and other smile-adjusted deltas that are either model-free, in the sense that they are the same for every scale-invariant stochastic and/or local volatility model, or they are based on simple regime-dependent parameterisations of local volatility. About 80% of trading activity is on expires of less than four weeks, so the paper focuses on comparing the hedging performance of different smile-adjusted deltas with synthetic constant maturities of 10, 20 and 30 days, for a wide range of OTM call and put options. We find that there are periods when the sticky-moneyness delta significantly outperforms the standard Black-Scholes delta. The minimum-variance delta is also better than Black-Scholes, but only for at-the-money (ATM) options where it coincides with the sticky-tree delta. Efficiency gains from smile-adjusted delta-hedging can exceed 30% for OTM puts, and average about 15% when hedging short-term OTM calls during periods when the implied volatility curve slopes upwards. The advantage of using the perpetual contract as the hedging instrument (instead of the calendar futures of the same maturity as the option) is especially evident for the longer-term contracts where the basis on calendar futures is still rather large.
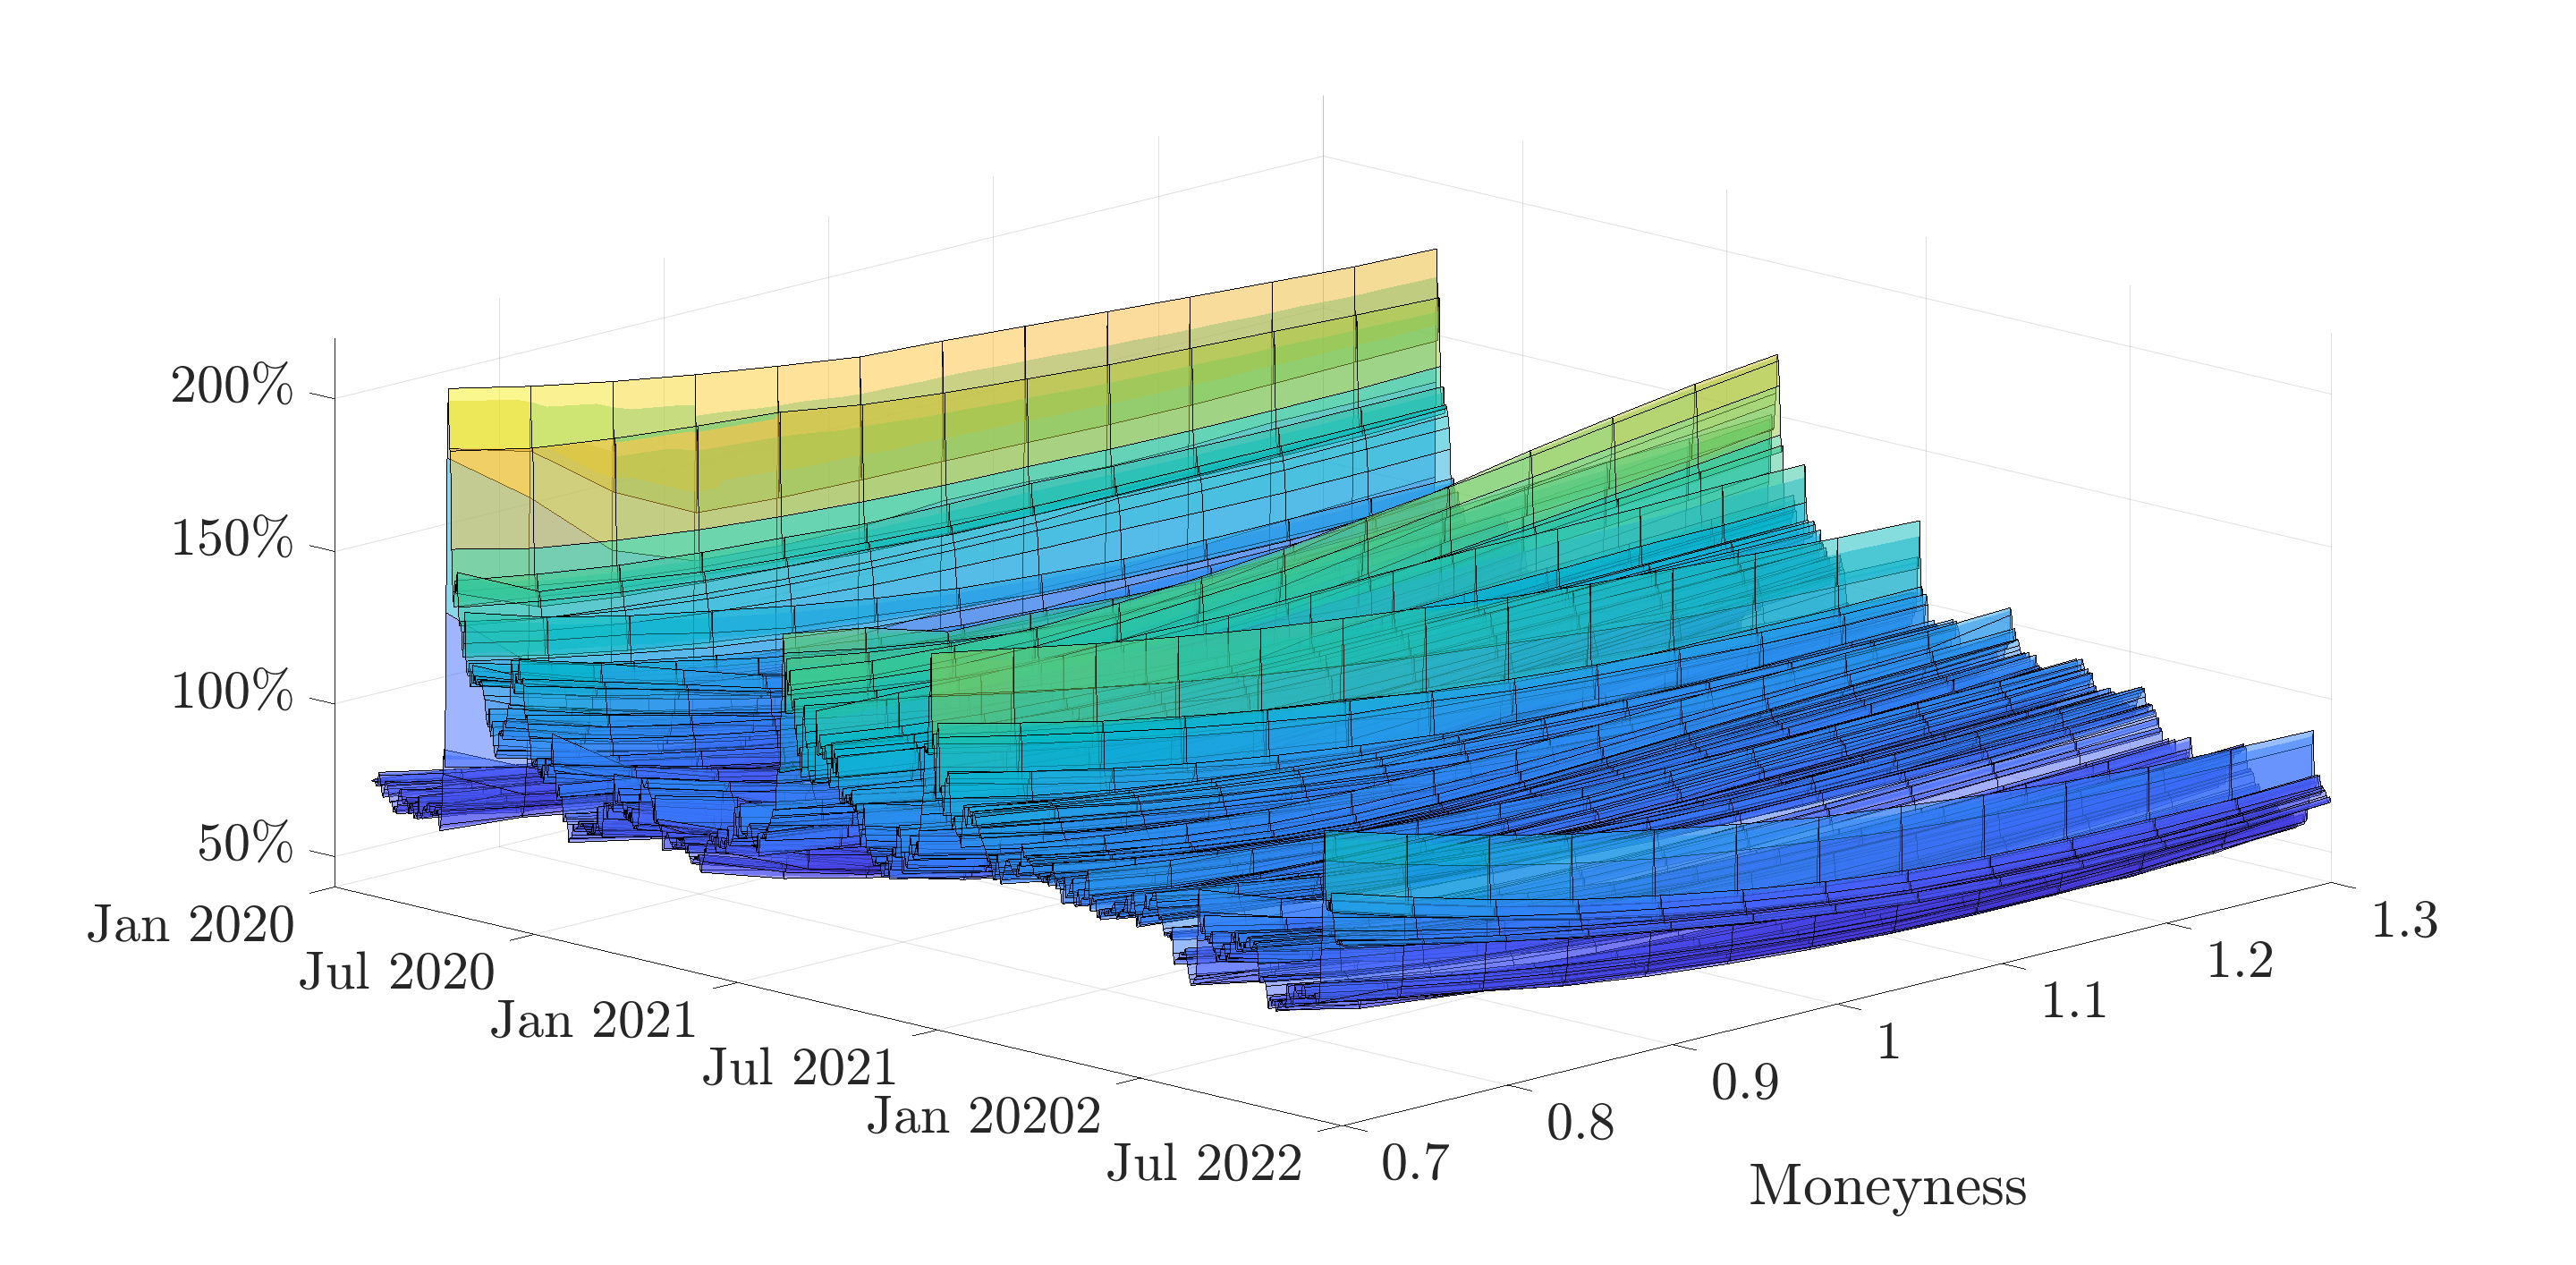
Figure 3: Evolution of Bitcoin Implied Volatility Curves
Implied volatility curves with 30-day constant maturity, daily between 1 January 2020 and 31 May 2022. Synthetic strikes range from 30% below to 30% above current value of the underlying index, for OTM puts and calls respectively.
The bitcoin implied volatility surface behaves differently from those of established options markets. To see this, Figure 3 illustrates the evolution of the 30-day bitcoin smile from 1 January 2020 until 31 May 2022. The moneyness axis represents the liquid range of synthetic 30-day options, from out-of-the-money (OTM) puts with moneyness 0.7 to OTM calls with moneyness 1.3. A negative skew is apparent on Black Thursday, and again in May 2021 and in May 2022. But positive skews also occur (e.g. in February 2021) and very often the curve takes on a flat, symmetric smile shape rather like the implied volatility curves for foreign exchange options.
On 12 July I’ll also be talking about Alexander et al. (2022), soon available online at the Journal of Financial Markets. Here we use tick-level traded prices to analyse the buy-and-sell side pressures on options of different moneyness and maturities. As Deribit bitcoin options trading volumes increases over time there is considerable evidence that market makers are managing order imbalance and inventory more effectively. On the demand side it is volatility traders that drive both ATM and OTM option prices, but OTM put and call options are also driven by directional traders especially during the bitcoin price bubbles. Our tests also assess time-to-maturity and time-of-day effects.
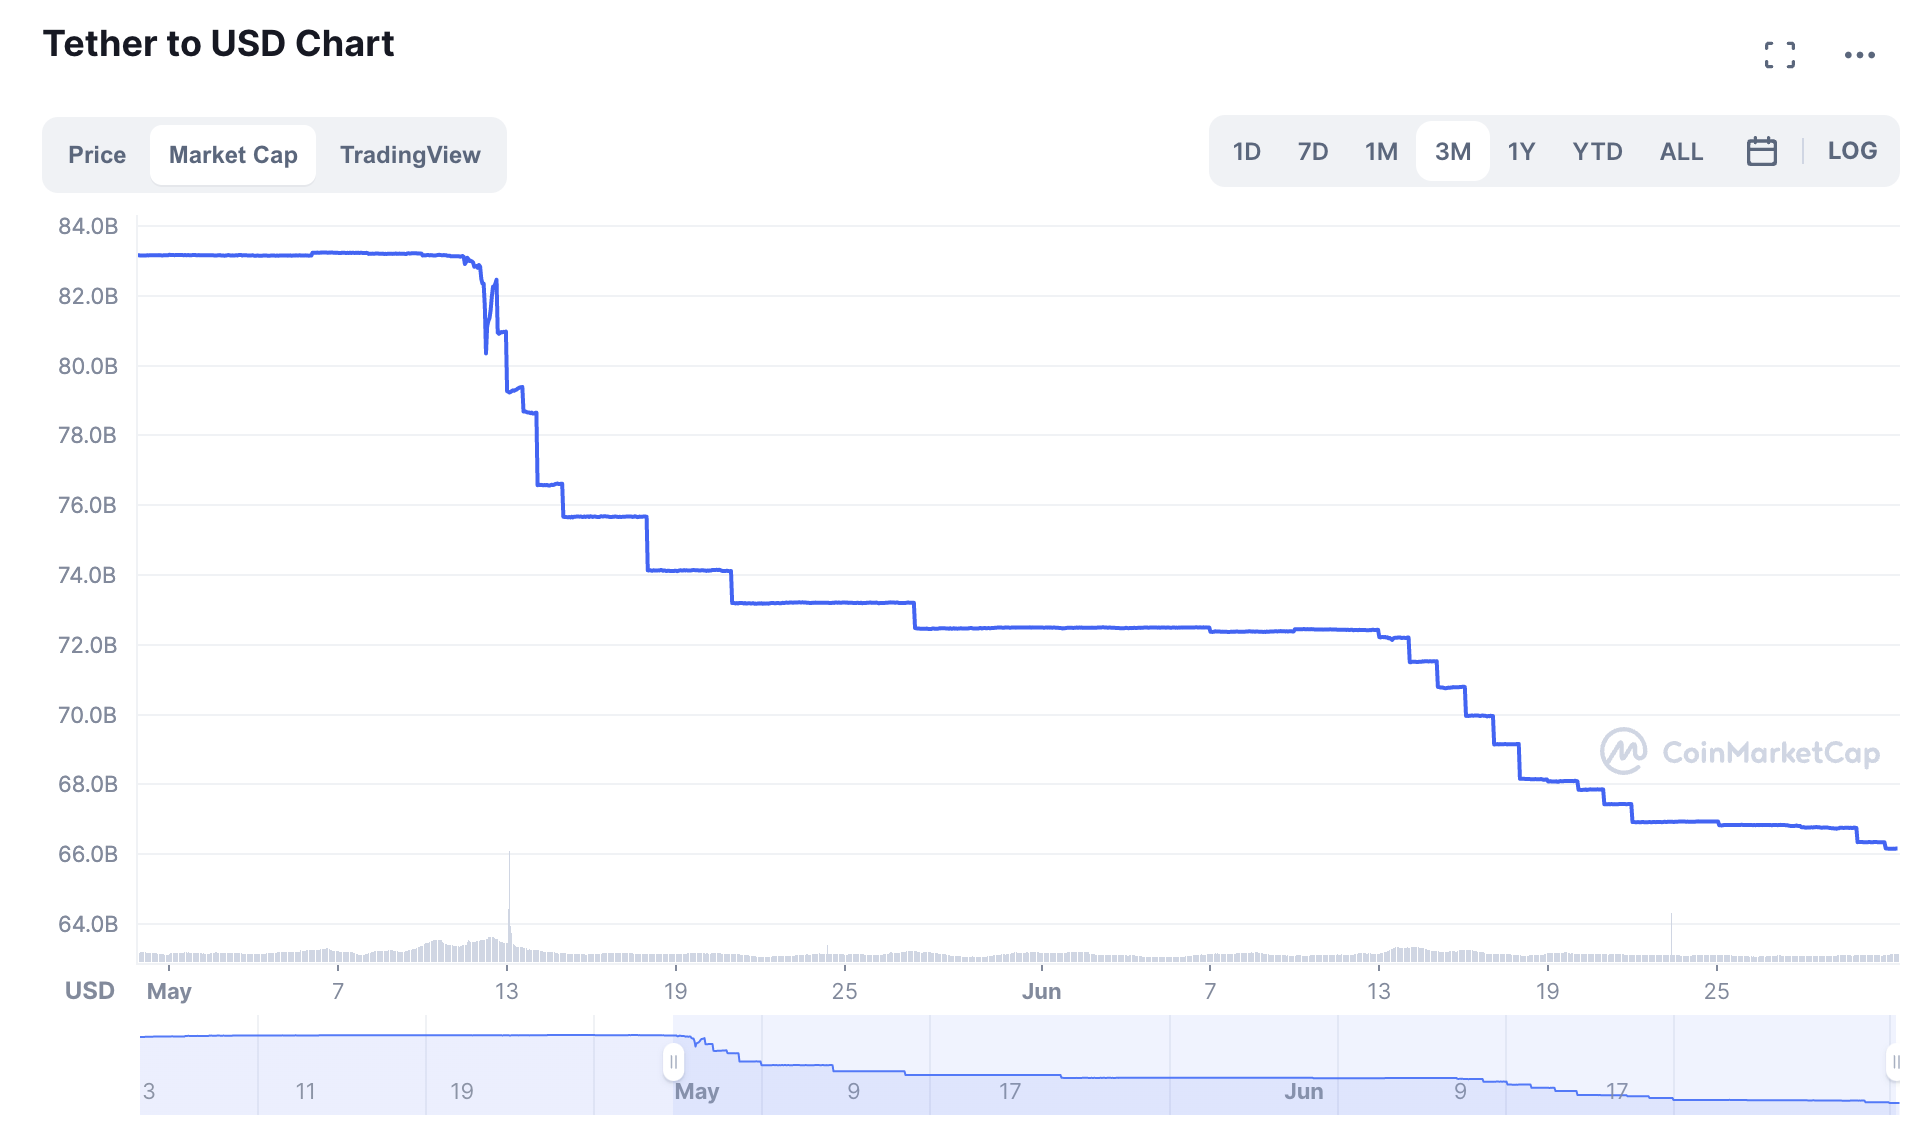
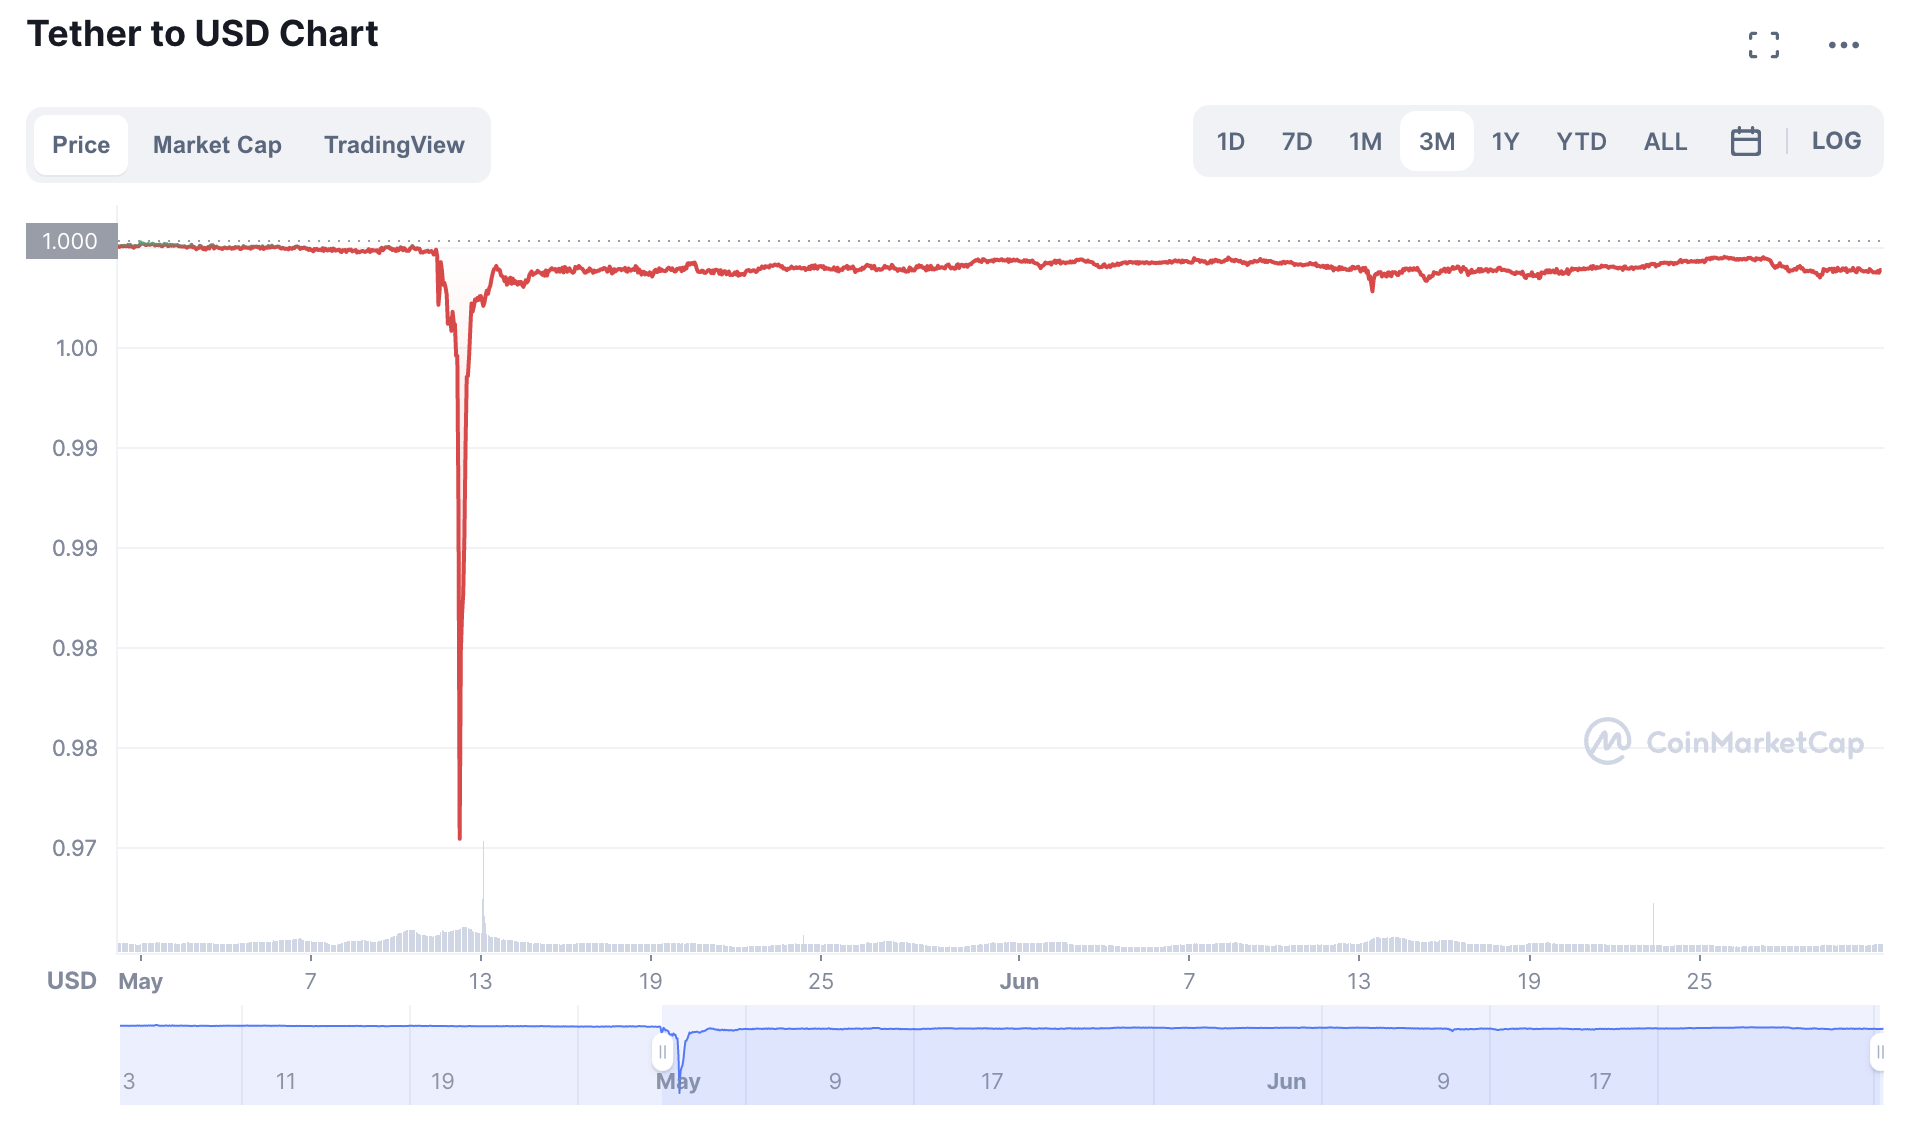
Figure 4: Market Cap and Price of USDT since May 2022
Source: CoinMarketCap
After the attacks on Terra/Luna and Celsius one may well ask – what next [6]? I think the crypto credit crunch will continue and perhaps Tether will be the next target. Paolo Ardoino, Tether’s CTO just tweeted that USDT lost 20% of its market cap because hedge fund whales have coordinated large short positions [7].At the time of writing the market cap of Tether’s USD stable coin has fallen from $83bn to $66bn (see Figure 4) and my guess is that it will continue to fall because the exchange-based arbitrage activities that hold the 1:1 USD peg will become too expensive against those mounting shorts. Perhaps Tether is losing the fair-weather friends to whom it once gave uncollateralised USDT loans. But anyone who reads my blogs – especially this one and this one – will be familiar with my view that tether is the main fuel behind the entire Ponzi scheme that is bitcoin, and that the volatility of bitcoin is driven by whales like those who attacked Terra/Luna and Celsius and who are now attacking Tether. It is these large-scale price manipulations, plus the fact that Bitcoin (unlike Ethereum) was only ever intended as a ‘toy’ blockchain, which make bitcoin one of the most speculative assets ever traded.
Citations and references:
[1] See Alexander et al. (2021) for an explanation of leverage selection and automatic liquidation on ‘self-regulated’ crypto derivatives exchanges and its affect on optimal hedging.
[2] These events have received a huge amount of media coverage. See, for instance, Nansen Analytics and The Guardian and The FT. Singapore-based Three Arrows filing for bankruptcy in the US will be interesting, with Deribit headquartered in Panama. An even greater debt, of over $350m has also forced New Jersey-based crypto broker-dealer Voyager Digital into Chapter 11.
[3] See historical values and live BVIN updates here.
[4] Data and analytics on these and other useful statistics are available from www.theblock.co and www.skew.com.
[6] In December 2021 I predicted that bitcoin would fall to around $10,000 during 2022.
[7] A ‘whale’ is an entity which holds a large amount of cryptocurrency for trading purposes.
Alexander, C., Deng, J., Feng, J., and Wan, H. (2022). Net buying pressure and the information in bitcoin option trades. Journal of Financial Markets, Forthcoming.
Alexander, C., Deng, J., and Zou, B. (2021). Hedging with bitcoin futures –the effect of liquidation loss aversion and aggressive trading. ArXiv, 2101.01261.
Alexander, C. and Imeraj, A. (2021). The bitcoin VIX and its variance risk premium. Journal of Alternative Investments, 23(4):84–109.
Alexander, C. and Imeraj, A. (2022). Delta hedging bitcoin options with a smile. SSRN, 4097909.