What is an alpha of trend-following CTAs?

We introduce a novel approach to measure skill-based alpha generated by a systematic investment strategy and its manager by splitting the risk-premia Jensen’s alpha into the structural risk-premia and the skill-based alpha. Conceptually, our approach is rooted on the replication of convex payoffs and on the evaluation of the structural risk-premia arising from investors’ preferences for convex payoffs using tools of option trading and mathematical economics. We illustrate this approach using a sample of trend-following CTA funds and demonstrate a high dispersion of skill-based alpha even for top performing CTAs.
Regime-conditional profile of strategy betas
As we discussed previously, most systematic strategies exhibit regime-conditional betas to returns of a benchmark equity index. In Figure 1, we illustrate the risk profile of two flagship quantitative strategies – the trend-following strategy, using the SG Trend Index (NEIXCTAT Index), and the tail-risk volatility strategy, using by the CBOE Eurekahedge Tail Risk Hedge Fund Index (EHFI453 Index), by applying the conditional beta model in Sepp-Dezeraud (2019).
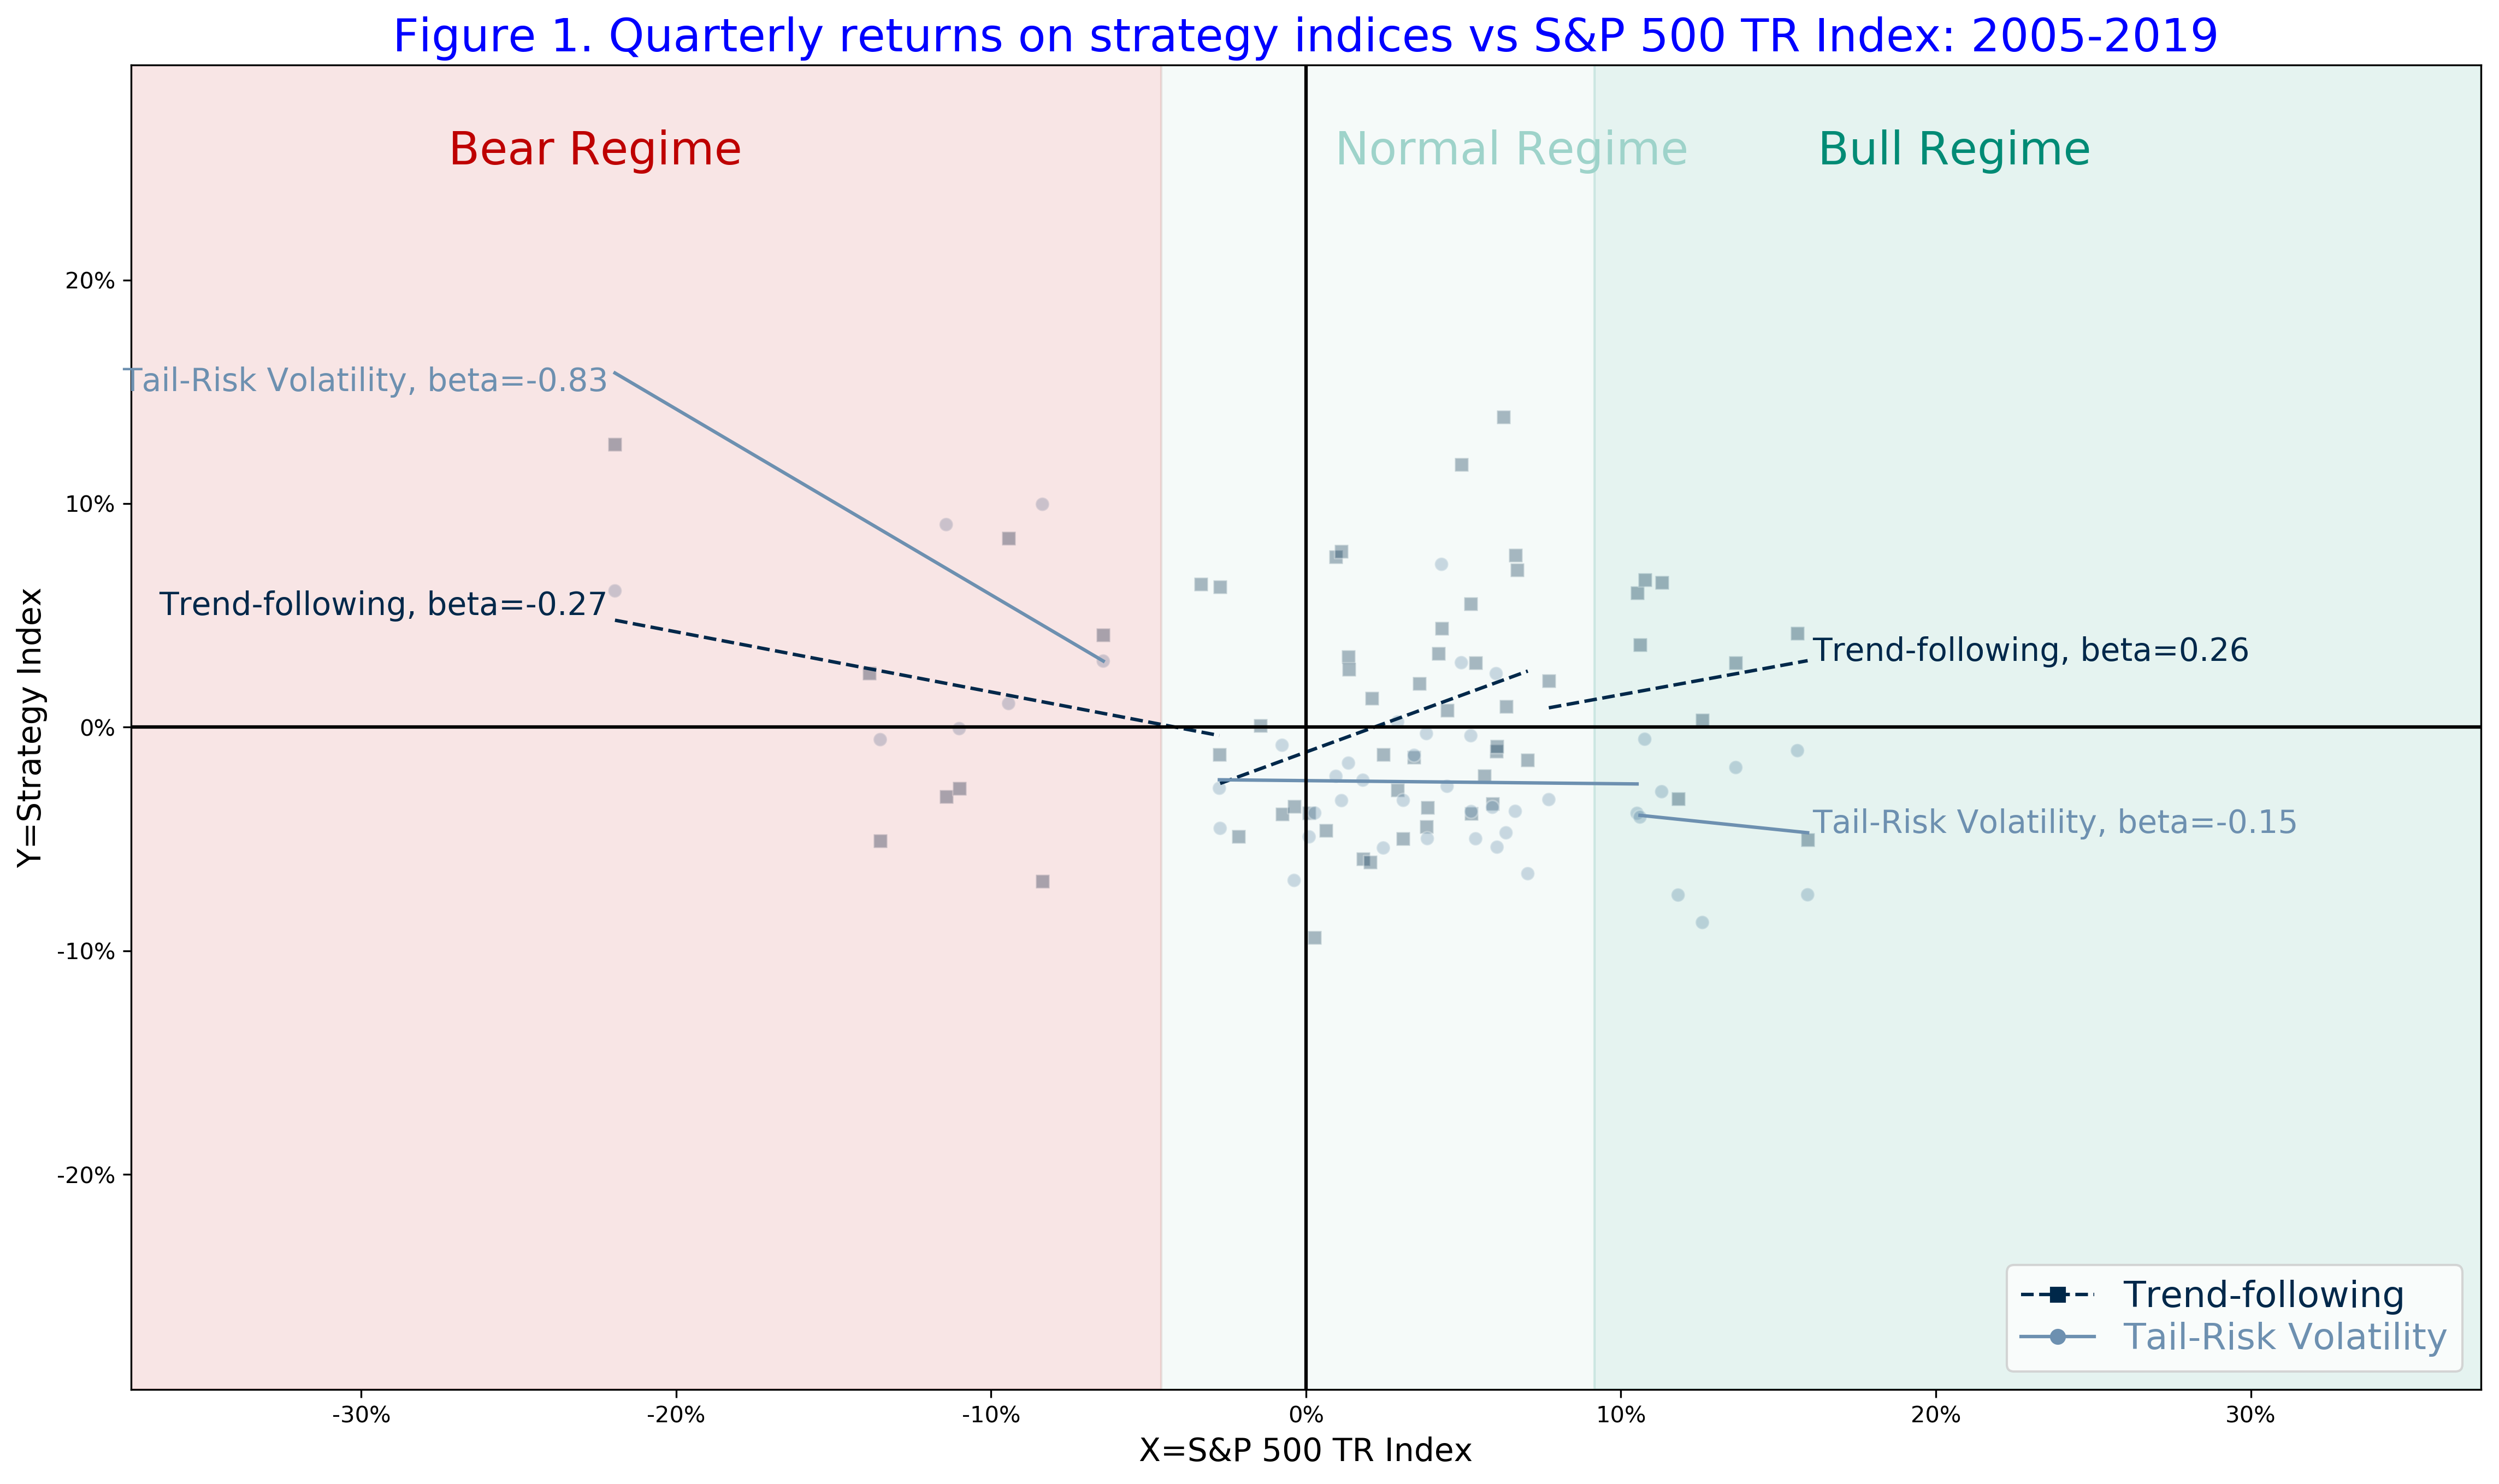
The beta profile of the Tail-Risk Volatility Index resembles the profile of a strategy that buys out-of-the money index puts. The strategy gains significantly in bear regimes but loses in normal and bull regimes with the negative performance mostly attributed to the negative volatility risk-premia. We can measure the volatility risk-premia as the spread between the implied and realized volatilities. The spread is negative on average which may be explained because of investors’ preferences for hedging and convex payoffs.
The SG Trend Index has a negative index beta in the bear regime, so that the index may provide a diversification of equity risk. In symmetry, the SG Trend Index has a positive beta in the bull regime, so the index is also expected to participate in equity bull regimes.
Both indices correspond to the style of systematic strategies with convex profile. In the case of option-based strategies, investors pay a risk-premia to buy convex payoffs which is expected to produce negative overall performance for strategies that aim at replicating the convex payoffs. By evaluating the realized performance of managers who provide such strategies we need to separate the negative impact of the risk-premia associated with the type of tail hedging strategies. Similarly, to evaluate the risk-adjusted excess performance of trend-following CTAs we need to estimate the structural risk-premia that may be associated with these convex strategies.
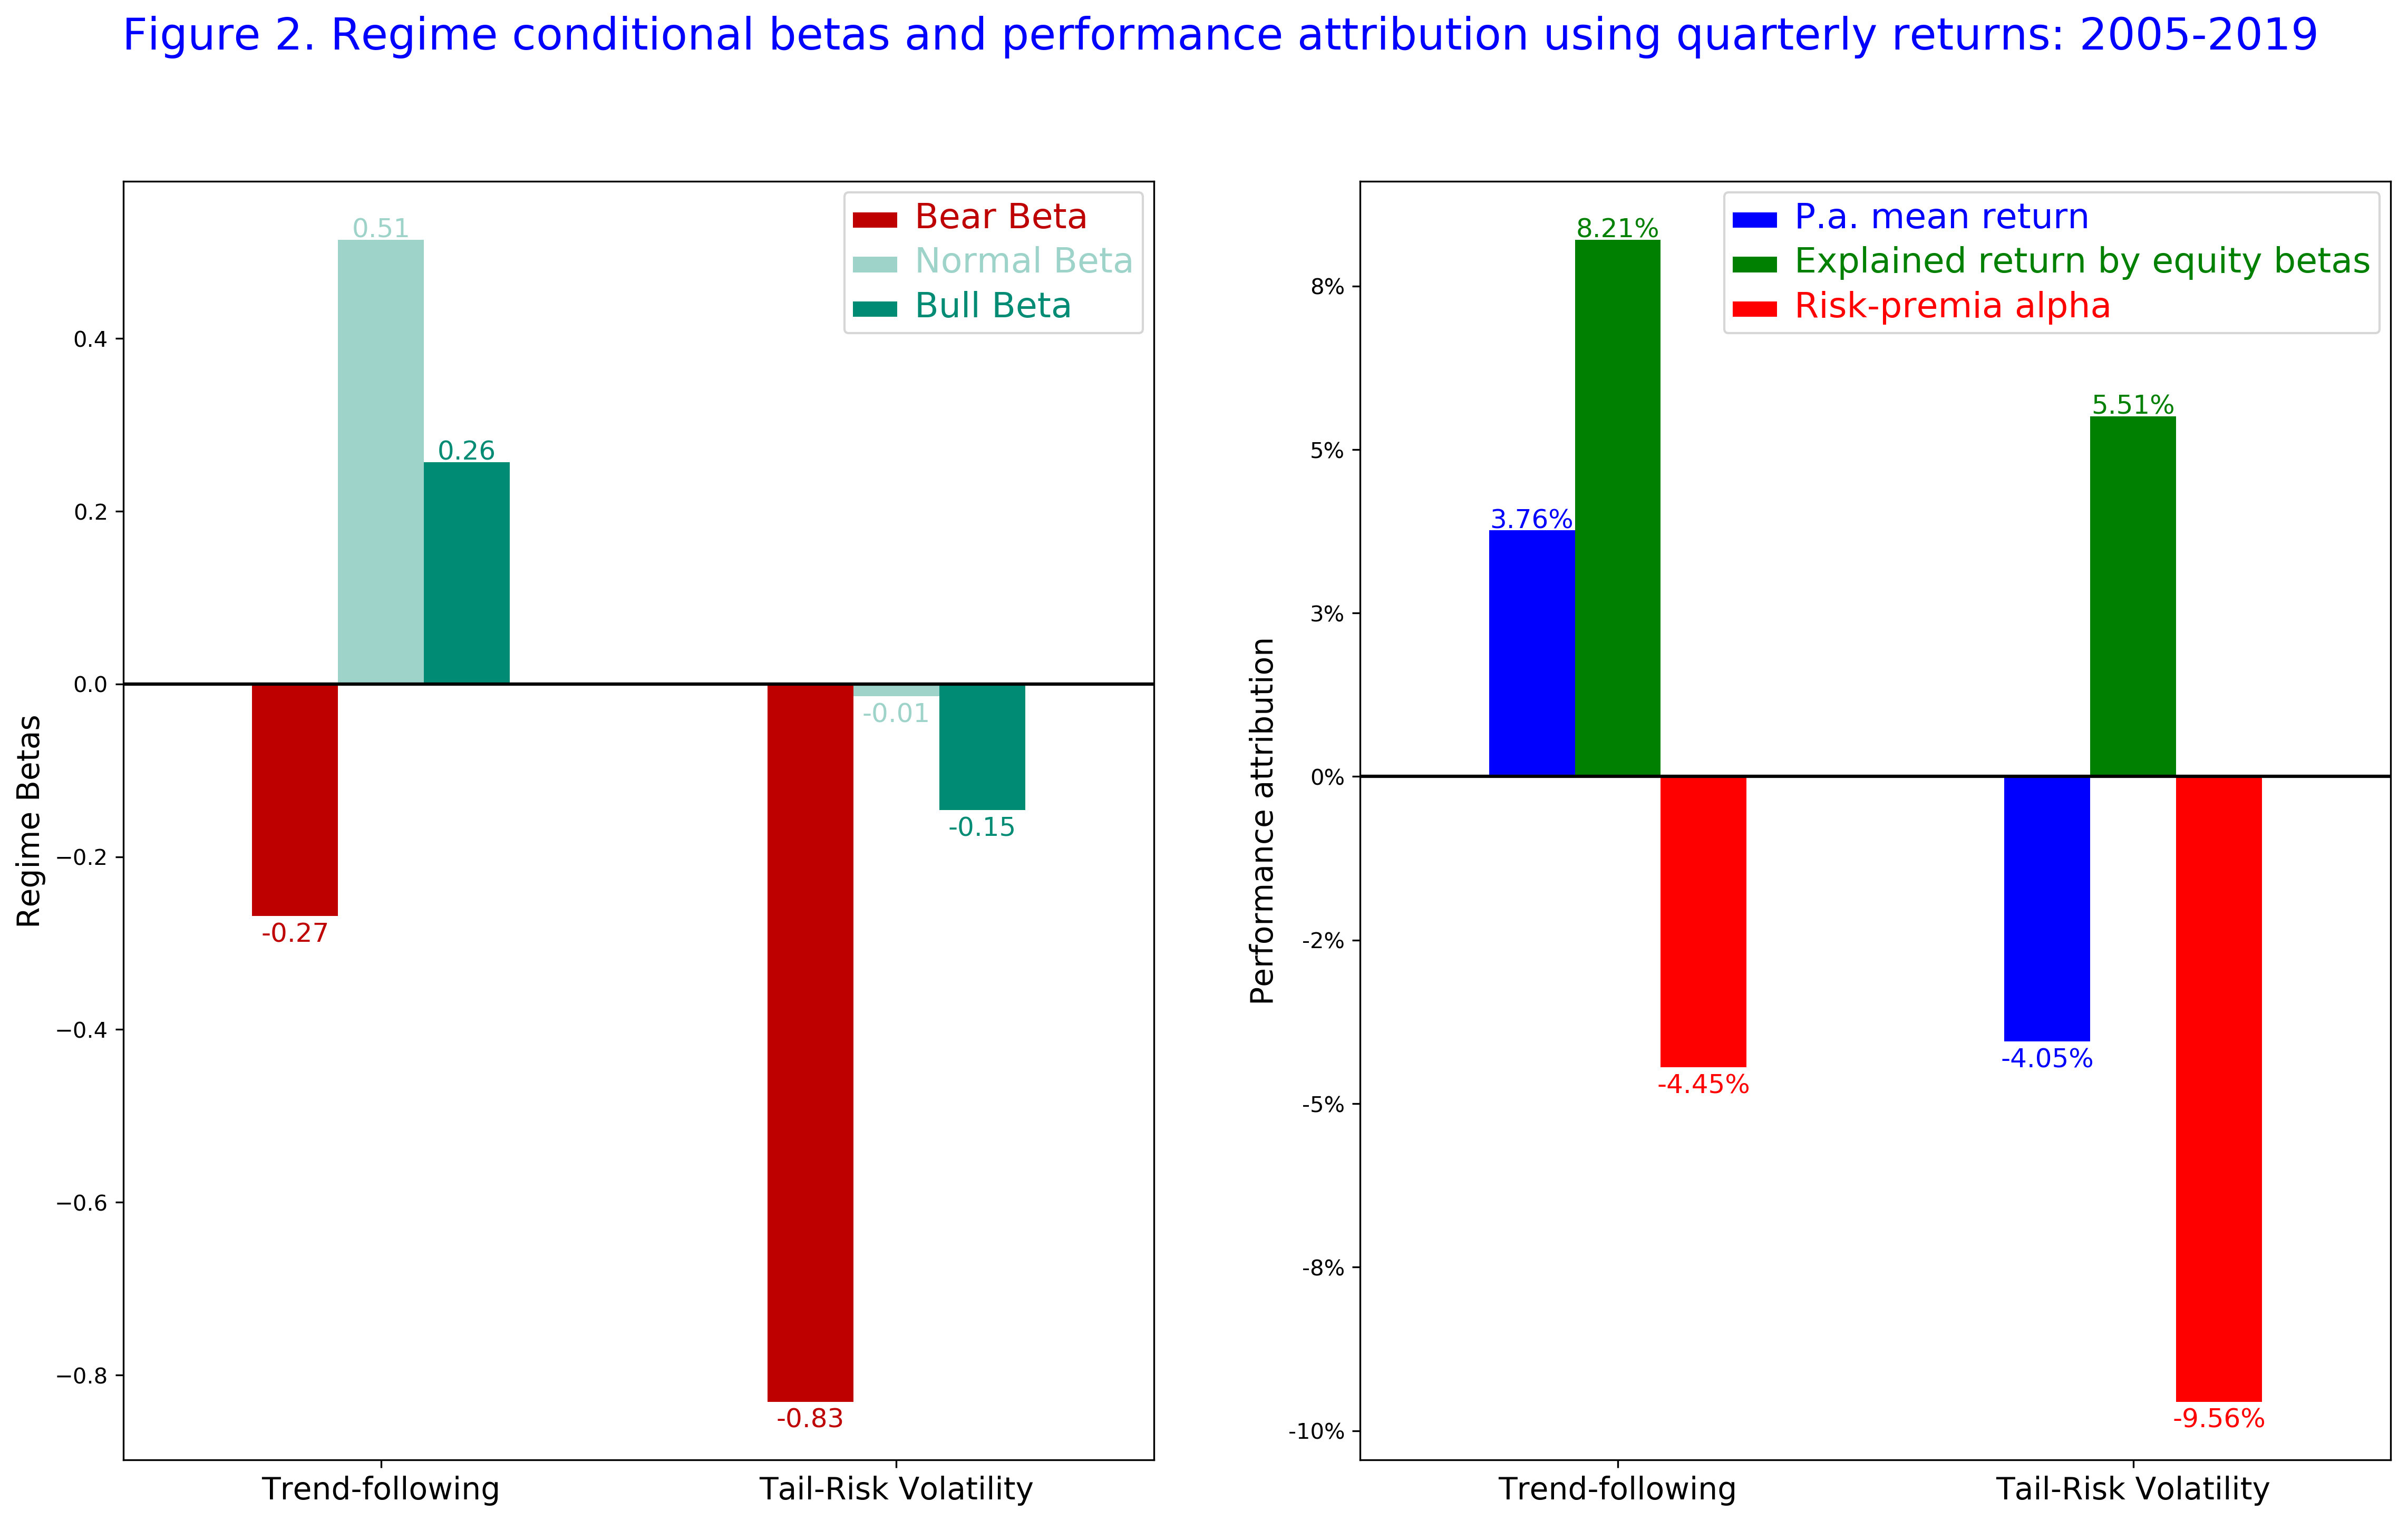
In Figure 2, we summarise strategy betas and attribution analysis for the two indices.
- Annual mean return is the average quarterly return multiplied by 4.
- Annual return explained by the equity betas is the average prediction using quarterly returns of the equity benchmark index and equity betas from the regime-conditional regression model, annualised by the factor of 4.
- Risk-premia alpha is the intercept of the regime-conditional regression model, or alternatively the Jensen’s alpha, multiplied by 4.
Not surprisingly, the annual mean return on the Tail-Risk Volatility Index is negative. However, we see that the beta contribution is actually positive so that the risk-premia alpha must be lower than the annual mean return. As a result, the risk-premia alpha must be rooted in the negative structural costs associated with buying the tail-risk protection. As a result, the risk-premia alpha may not be reflective of managers’ skills. In case of the SG Trend Index, the negative risk-premia alpha represents trading costs to produce the convex profile of trend-following returns: for an example, costs produced by frequent trading during volatile but range-bound markets.
Now we consider a practical question of how to assess the performance of a systematic investment strategy that may have specific structural risk-premia and style costs as follows.
- While the total return is the most important criteria, for most of the systematic strategies, especially for the tail-risk protection, most of the gains materialise over infrequent short periods.
- Returns explained by equity betas of a strategy may be significant even though a strategy may appear to be uncorrelated to the equity index over time. This is due to the regime-conditional beta profile, as for an example produced by the SG Trend Index.
- The risk-premia alpha (Sepp-Dezeraud (2019))or Jensen’s alpha is defined by the intercept of the regime-conditional regression (for simplicity we omit the risk-free rate):
risk-premia alpha
= realised mean return
- explained return by strategy equity betas
The risk-premia alpha may reflect the structural costs of a replication of a particular strategy style. Hereby, the structural costs are likely to be outside of the control of the manager. For an example, a manager running a tail-risk protection strategy is facing risk of significantly negative volatility risk-premia, while a manager running a trend-following strategy is facing a risk of consistently mean-reverting markets. Therefore, we propose a new methodology that connects the beta profile of a strategy with the cost of replication of the systematic strategy using portfolio of options.
Estimation of replication costs for an active strategy
Intuitively, the convexity profile of quarterly returns of a systematic strategy relative to an equity benchmark index, as illustrated in Figure 1, can be replicated with a portfolio of put and call options on the benchmark index with the portfolio rolled on a quarterly basis. Indeed, Dao et al (2017) show how a quadratic profile of a trend-following strategy can be replicated with options. As we know from the science of derivatives trading, any vanilla option can be replicated by a dynamic trading strategy in the underlying only.
Now we consider a framework with the two opposing sides.
- An active manager trades dynamically in a basket of securities correlated to the benchmark index. The active strategy generates a regime-conditional profile as shown for example in Figure 1.
- A passive manager aims at replicating the regime-conditional profile of the active manager. Each quarter, the passive manager rolls a static portfolio of vanilla options designed to match the regime-conditional return profile of the active manager.
We illustrate this framework using an example of a strategy that buys index put options on a quarterly basis (similar to a typical strategy in the Tail-Risk Volatility Index). An active manager would trade dynamically in the benchmark index to replicate the pay-off of a put option, while a passive manager would buy index put options with the maturity of one quarter on a quarterly basis.
Intuitively, in the absence of arbitrage (including capital, information, and costs arbitrage), the realised risk-adjusted aggregated performance of all active managers should be equal to the aggregated performance of all passive managers. Now, because the replication cost of passive managers can be estimated using the cost of option rolls, we can apply the estimated costs to benchmark the replication cost of all active managers too.
As a result, we can estimate the roll costs of options to replicate the benchmark composed of all passive managers that will include any structural risk-premia over the long term. We apply the terminology of options trading and in particular the concept of volatility risk-premia defined as the spread between realised vs implied volatilities. For a given strategy, we define the style replication premia, which is a function of the regime-conditional betas of the strategy, as follows:
style replication premia (strategy betas)
= average realised payoff on the replication portfolio
- average costs of option roll to buy the replication portfolio
Since option prices include a structural risk-premia, associated with investors’ preferences for convex payoffs, the style replication premia is expected to be negative. If an active manager can generate the same return profile at lower costs, the active manager will thus generate the skill-based alpha. Intuitively, if an active manager aims at replicating a protective strategy such as buying put options, the style replication premia using a static portfolio of options would be deeply negative because of the structural risk-premia in put option prices, measured by the significant negative spread between realised and implied volatilities in the long run. However, if the active manager can deliver the same pay-off profile in average with lower costs, he/she would generate a positive skill-based alpha in the long term.
Formally, we define the skill-based alpha as follows:
Skill-based alpha
= risk-premia alpha
- style replication premia
As a result, we decompose the return of an active manager as follows:
mean realised return of an active manager
= explained return by equity betas
+ style replication premia (strategy betas)
+ skill-based alpha
Using this decomposition, we suggest that the manager’s skill-based alpha must be evaluated relative to the expected costs of replication of the strategy using a portfolio of options. The expected costs would incorporate any structural risk-premia associated with an option-based replication of the convex payoff generated by the manager.
Estimation of the style replication premia
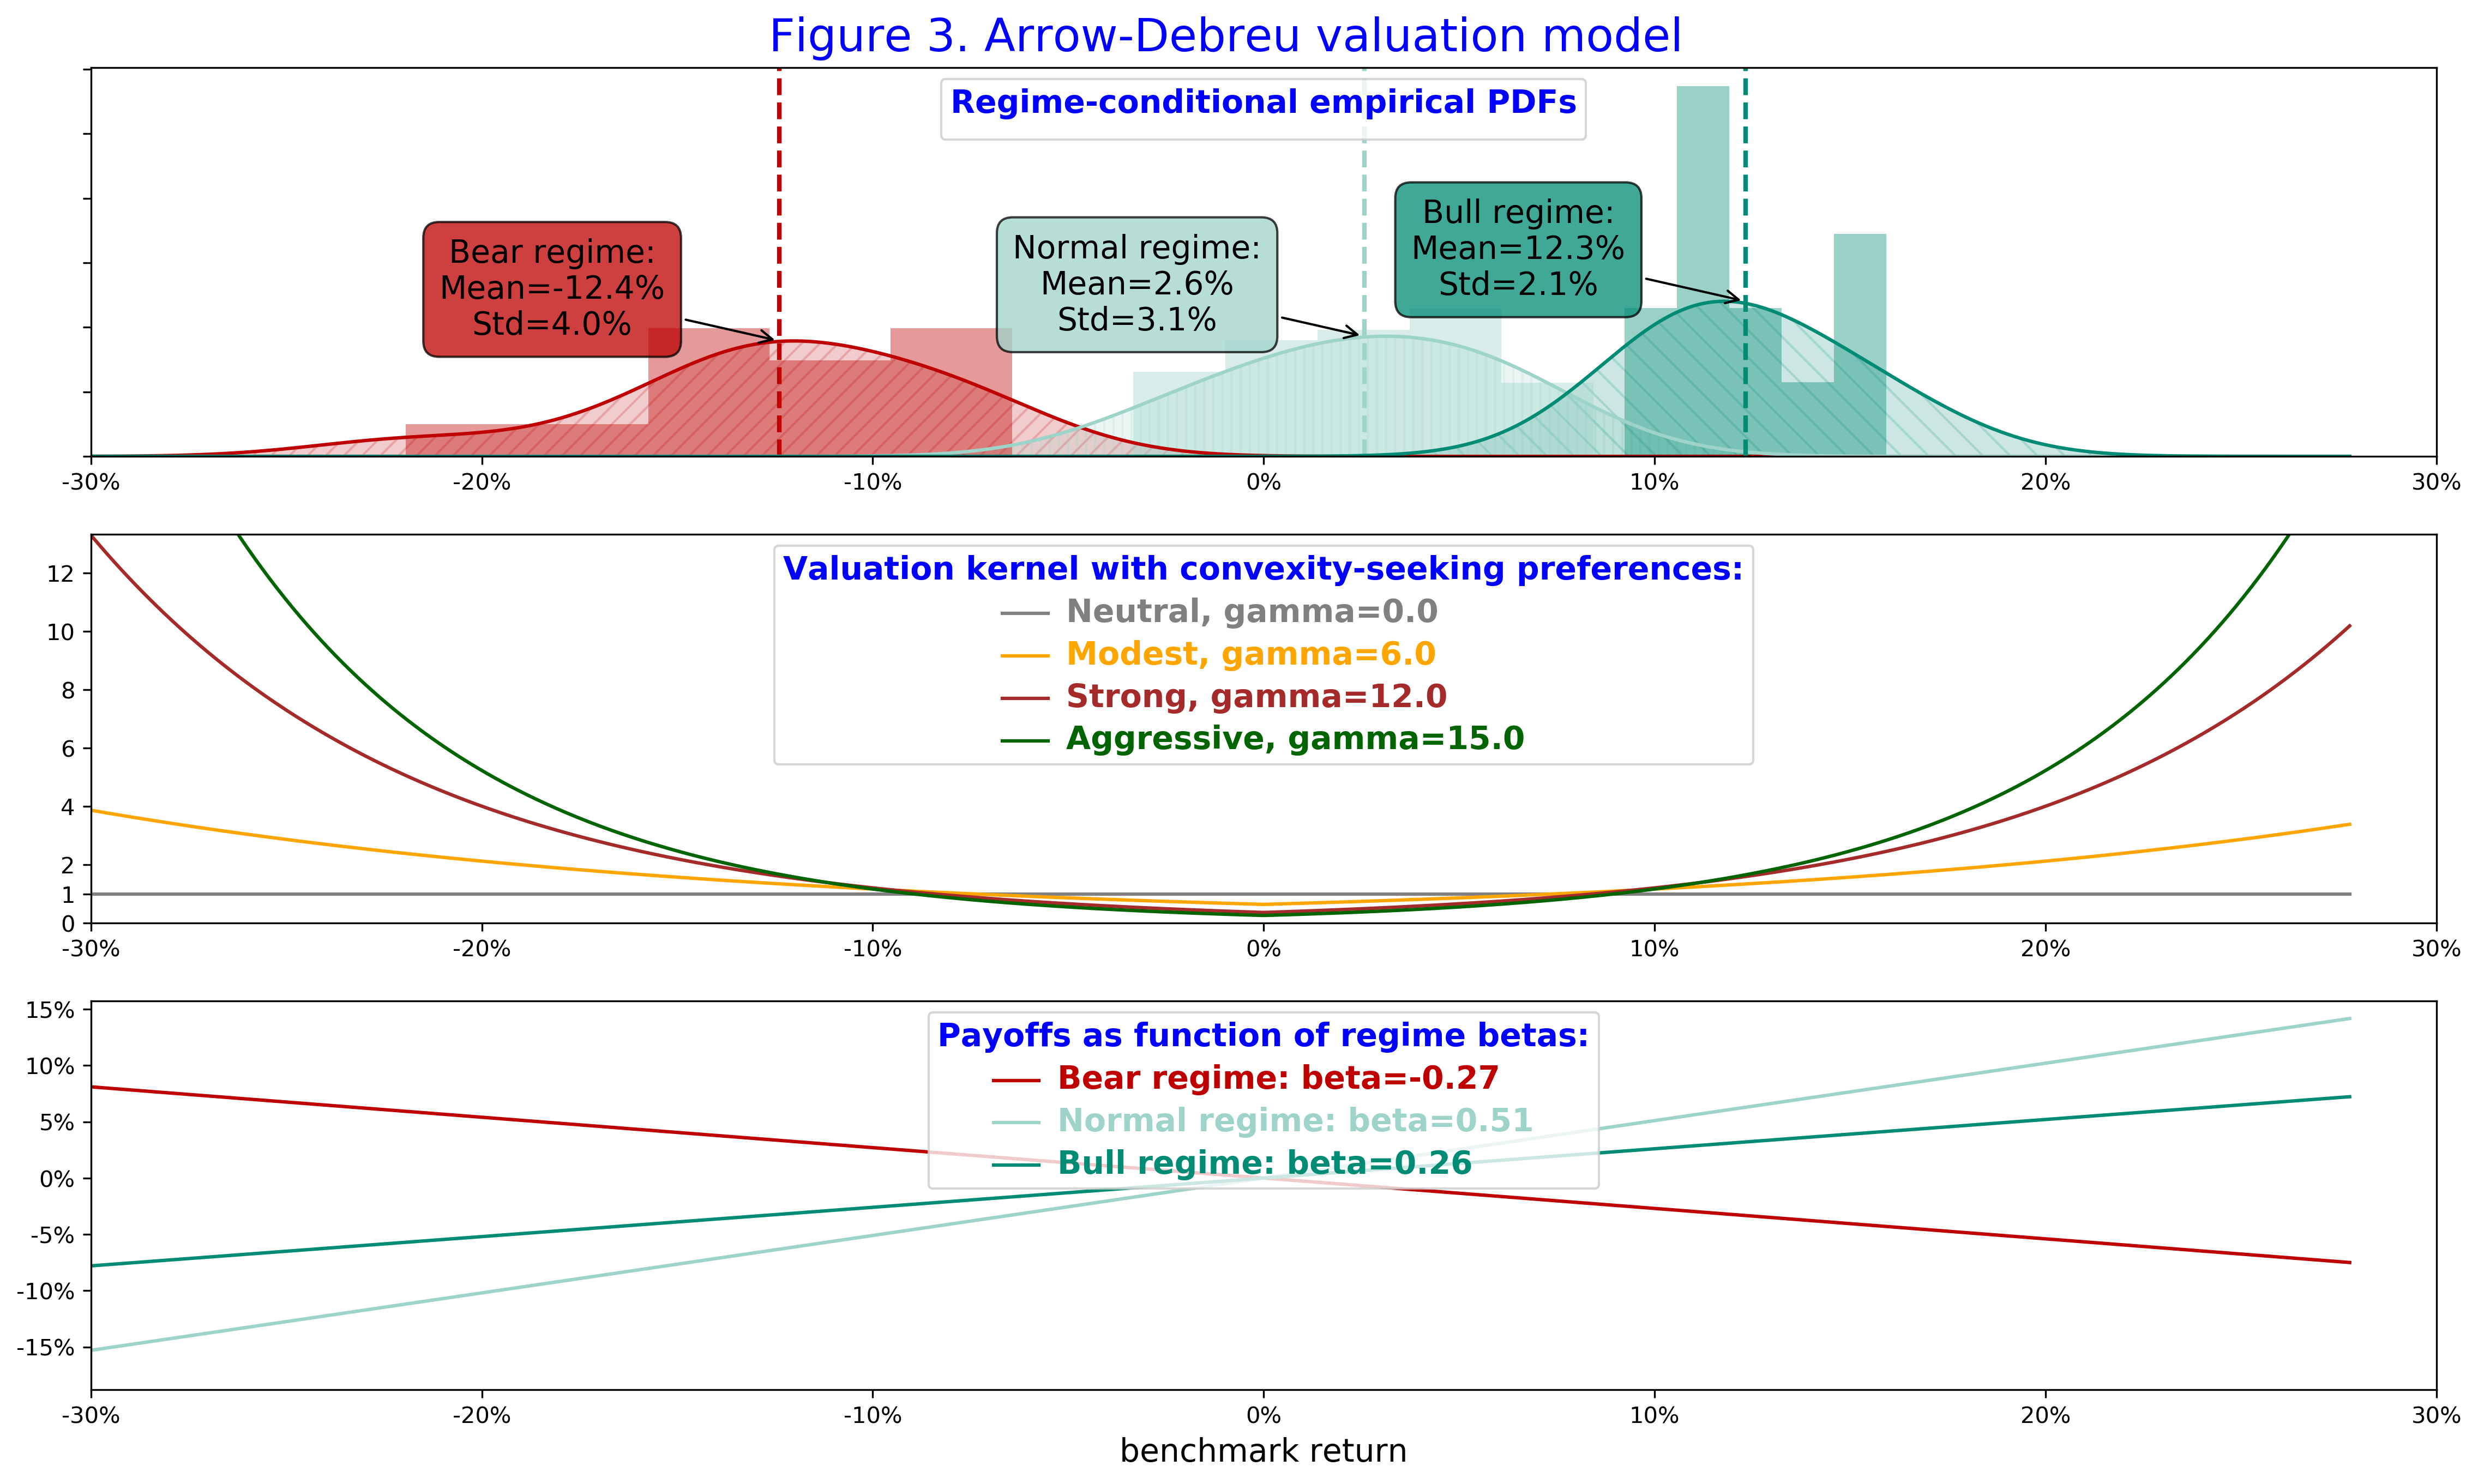
Here we describe the high-level details only and we will present technical detail in an expanded article. Using tools of mathematical economics, we apply the Arrow-Debreu valuation model with the regime-conditional state price densities. We use the empirical pricing kernel estimated using quarterly returns on the S&P 500 Index split into the bear, normal, and bull regimes according to our regime-conditional models as illustrated in the top of Figure 3.
The risk-preferences are modelled using the valuation kernel with the convex utility function with a single parameter for the convexity-seeking preferences, as illustrated in the middle of Figure 3. In this framework, investors overweight the preference for tail returns and thus they over-pay in average for securities that are expected to deliver highly convex payoffs. In turn, the preference for small returns is discounted so that the expected pay-off of $1 weighted by the kernel with given convexity-seeking parameter is exactly $1 today. As a result, investors’ risk-preferences cannot be met with cash so that cash is not an “option” in our framework. Instead, investors evaluate payoffs generated by strategy betas in different regimes, as illustrated in the bottom of Figure 3. The Arrow-Debreu value of any strategy is the aggregated value of its payoffs weighted by the valuation kernel. The risk-premia, which we also term as the style replication premia, is the spread between the Arrow-Debreu value and the expected payoff under the empirical measure without risk-preferences.
Intuitively, the higher are the convexity-seeking preferences, the higher is the style replication premia for passive strategies that generate the convex return profiles. In Figure 4, we illustrate the style replication premia for the SG Trend Index and the Tail-Risk Volatility given their regime conditional betas. As the convex-seeking utility increases, the convexity profile generated by both the SG Trend Index and the Tail-Risk Volatility Index becomes more valuable to investors. As a result, investors overpay for buying these strategies with the style replication premia indicating the spread between the realised payoffs and the valuation costs of these strategies.
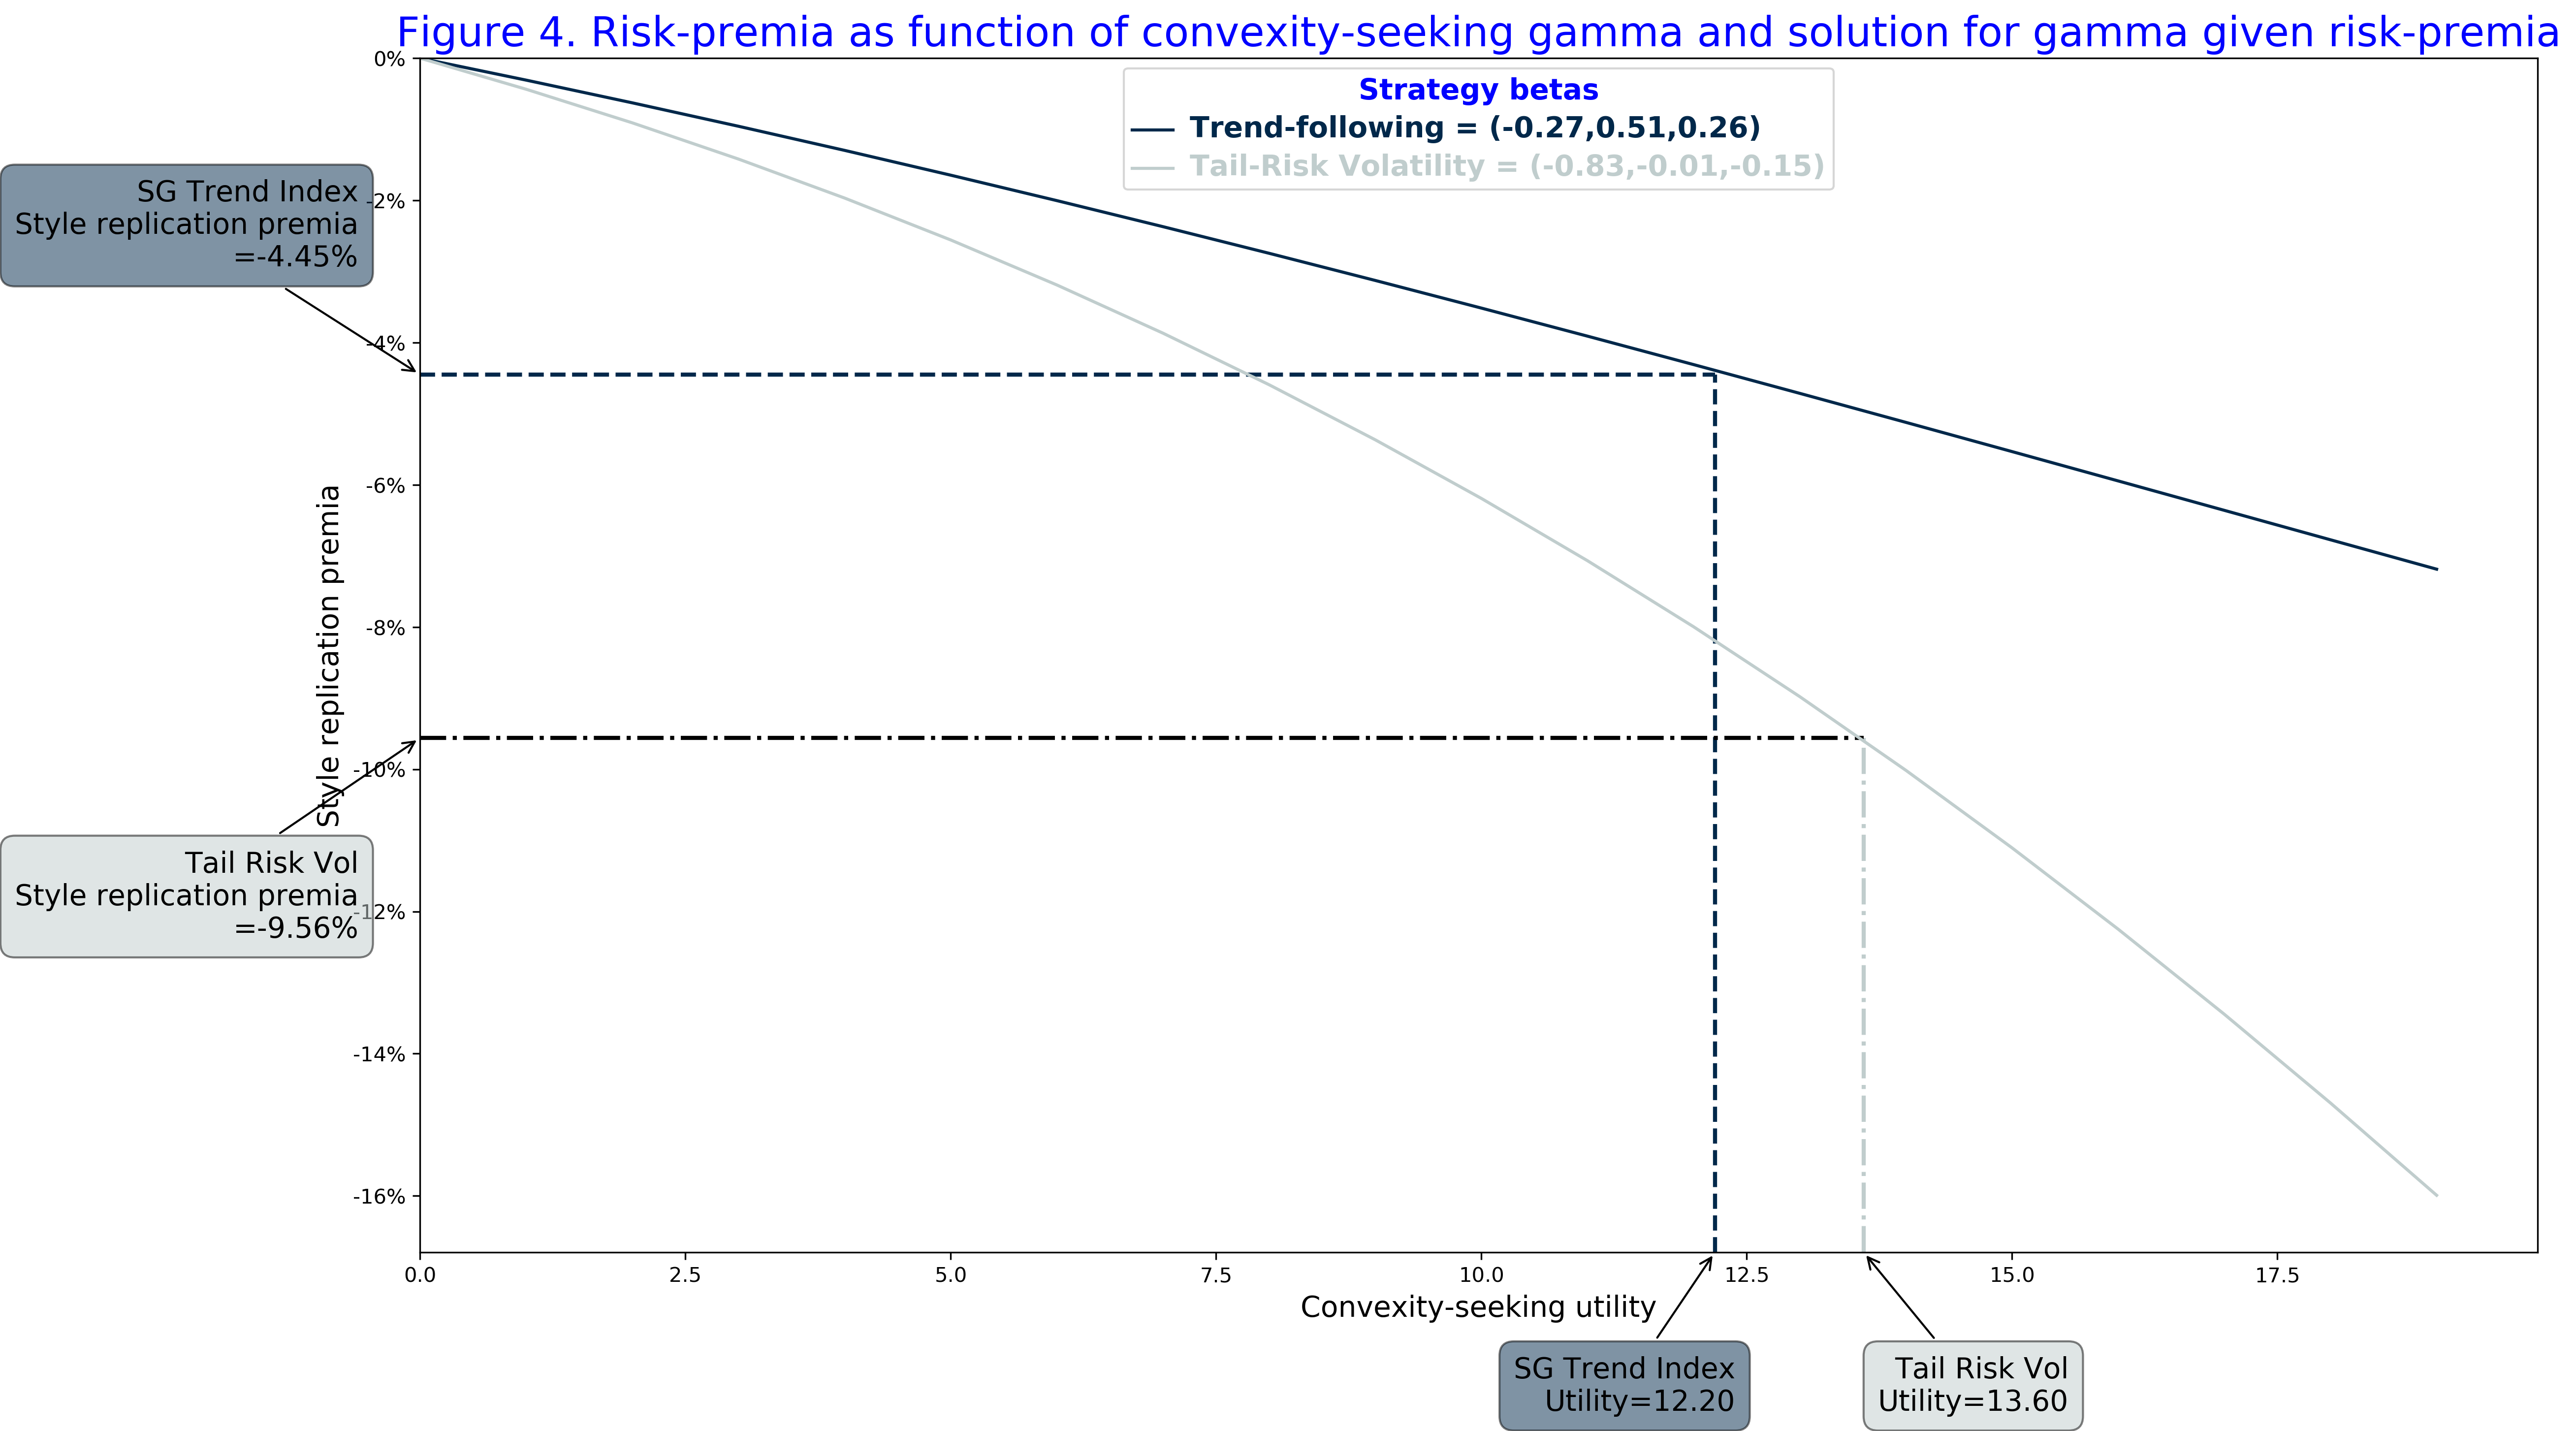
All being the same, investors with high preference for convexity would value the convexity generated by the Tail-Risk Volatility Index higher than the convexity of the Trend-following Index. Therefore, the style replication premia is expected to be higher for the volatility-based strategies.
Finally, we assume that on average for a given strategy style, the risk-premia alpha aggregated across all managers should be equal to the style replication premia. In other words, the skill-based alpha associated with a benchmark for the strategy style should be zero. This amounts to the same assumption that aggregated excess returns of active managers of the same strategy style must be zero.
Now, given the estimated risk-premia alpha of -4.45% and -9.56% of the SG Trend Index and the Tail-Risk Volatility Index, respectively, we can solve the inverse problem, as illustrated in Figure 4, and to find the value of the convexity-seeking utility that corresponds to convexity profile of the strategy style.
In other words, in our Arrow-Debreu valuation model, we can solve for the equilibrium convexity-seeking utility function which will make the convexity-seeking investors indifferent whether to invest in the style strategy through either an active index, obtained by aggregating results of active managers, or through a passive index replicated with options. Given an estimate of the equilibrium convexity-seeking kernel, we thus define the equilibrium valuation kernel. Further we apply the estimated kernel to evaluate the style consistent replication premia for all active managers of the same style strategy.
Illustration using trend-following CTAs
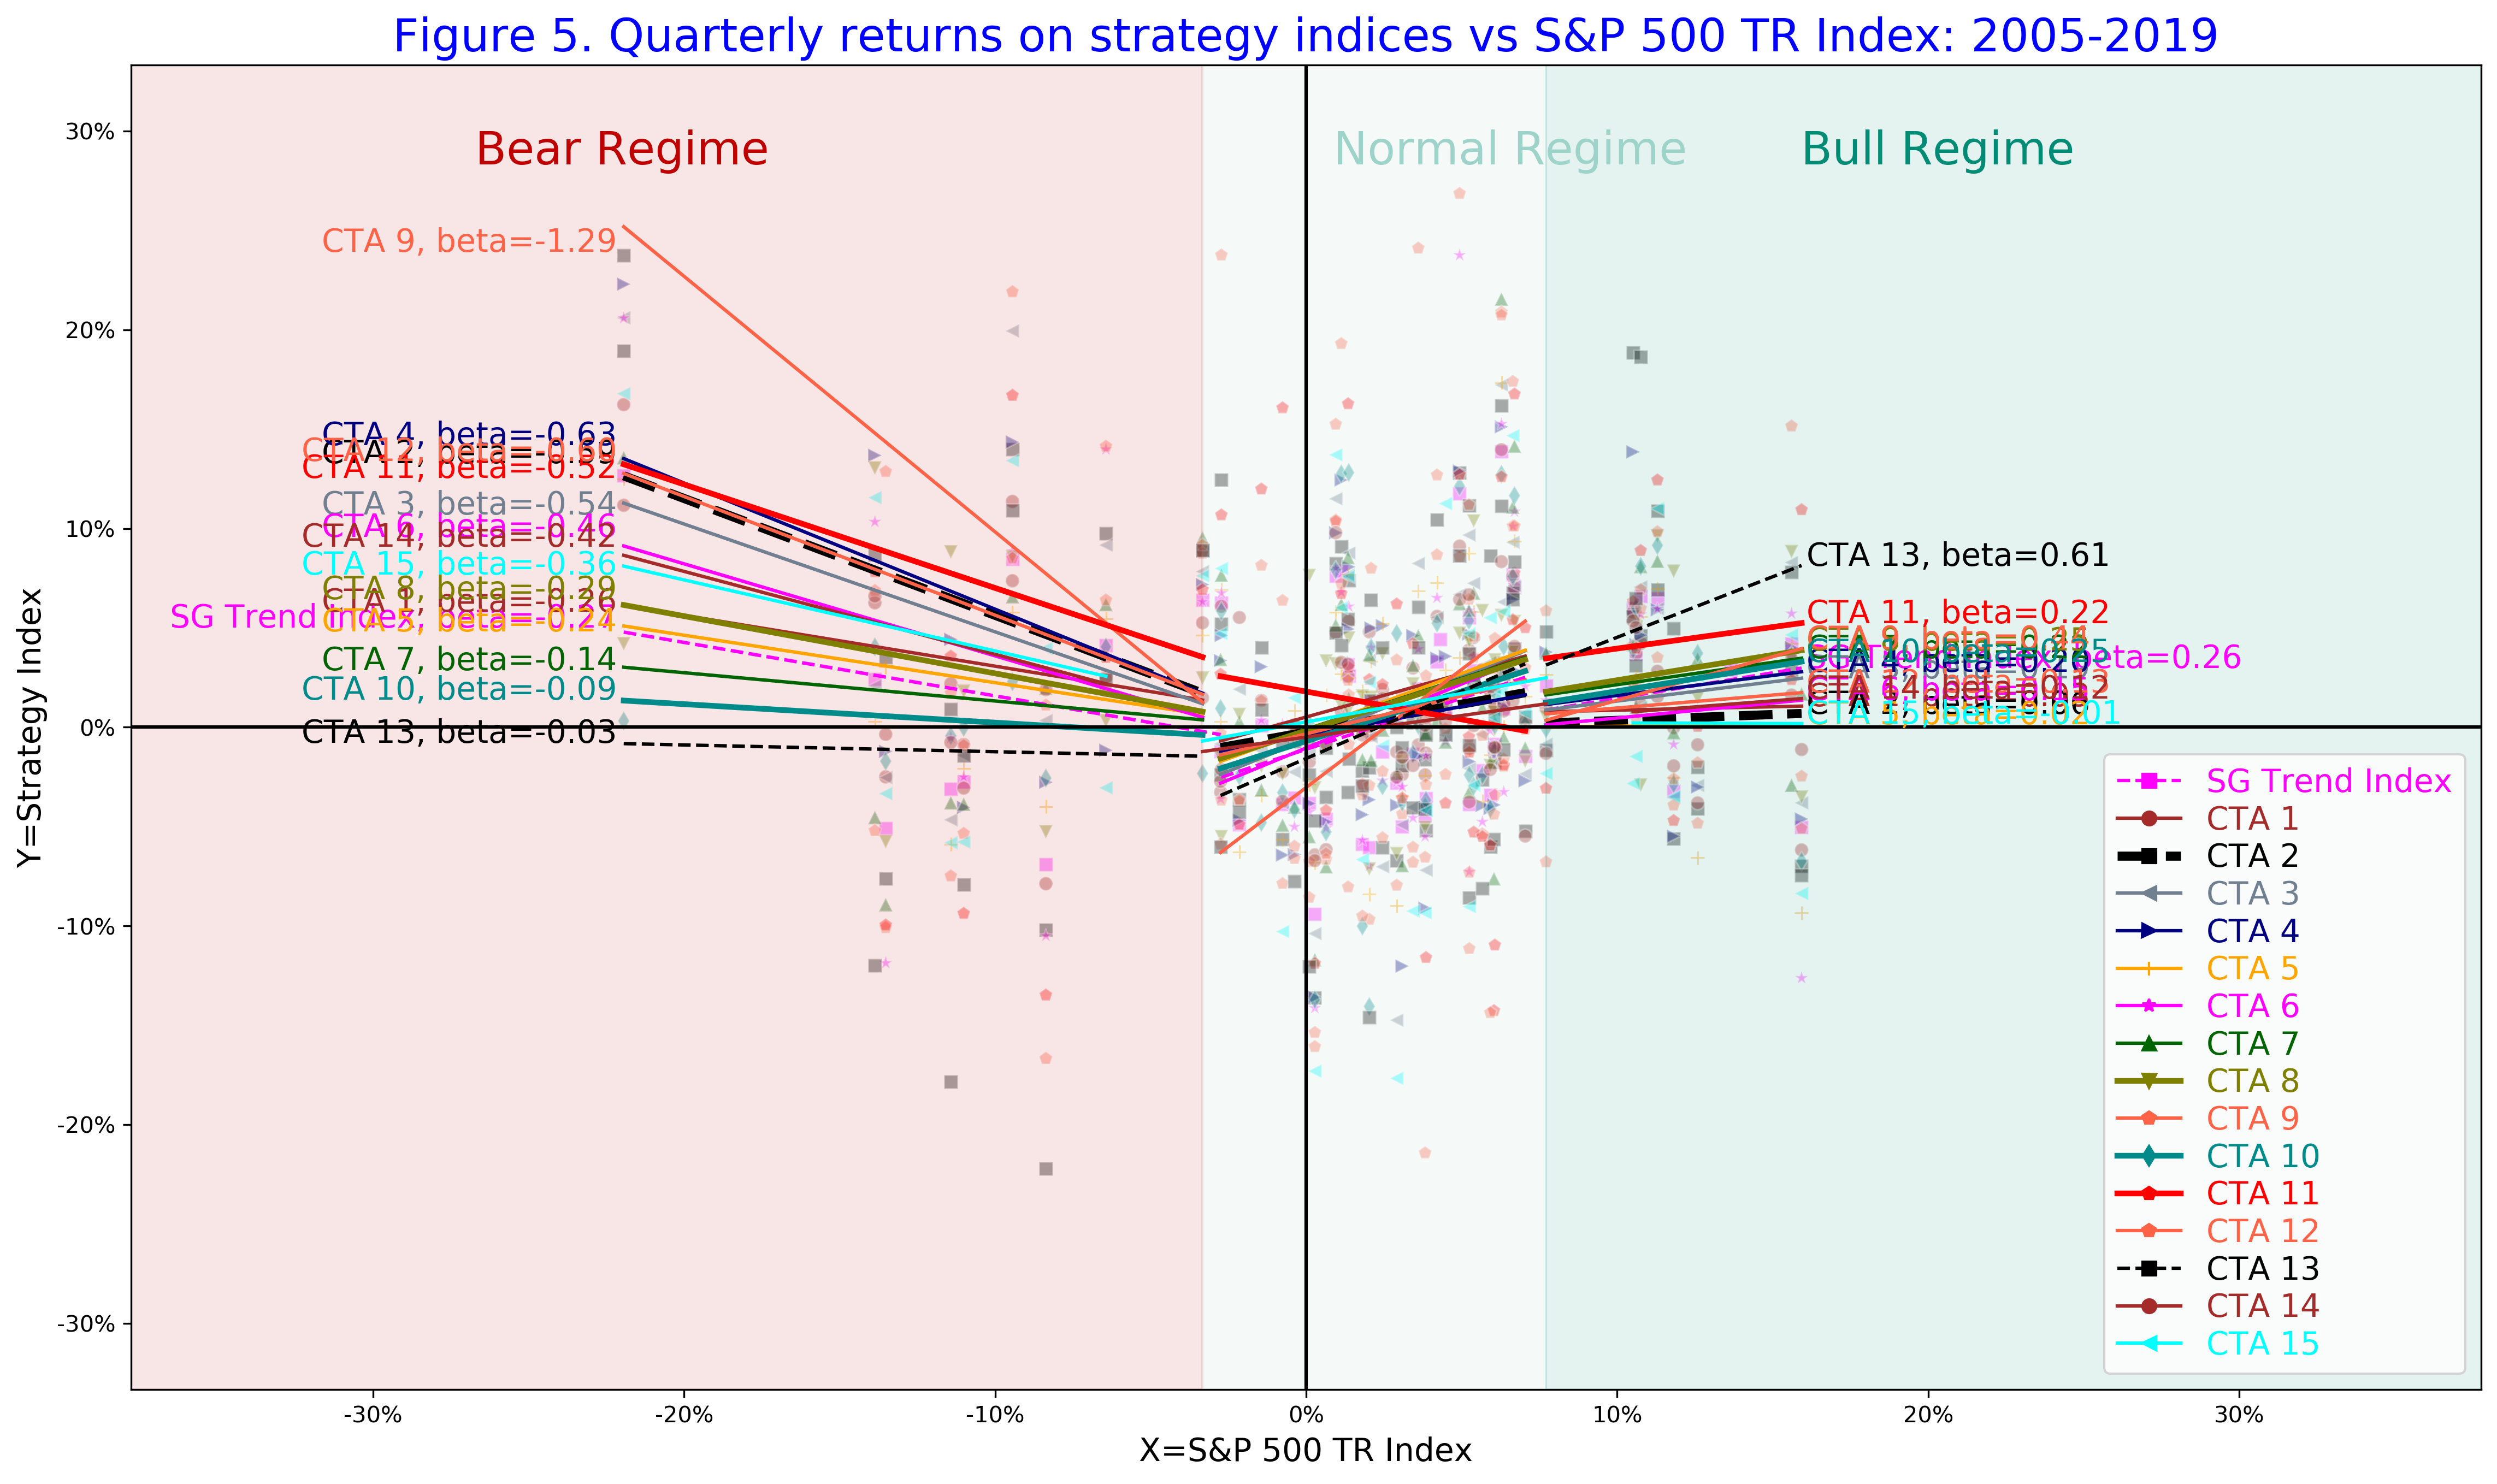
In Figure 5, we show the beta profile of the SG Trend Index and 15 CTA funds with the track record from at least 2005. Importantly, we see that the regime-conditional betas can be very disperse among different CTA managers even though the convexity profile is observed for all of the trend-followers.
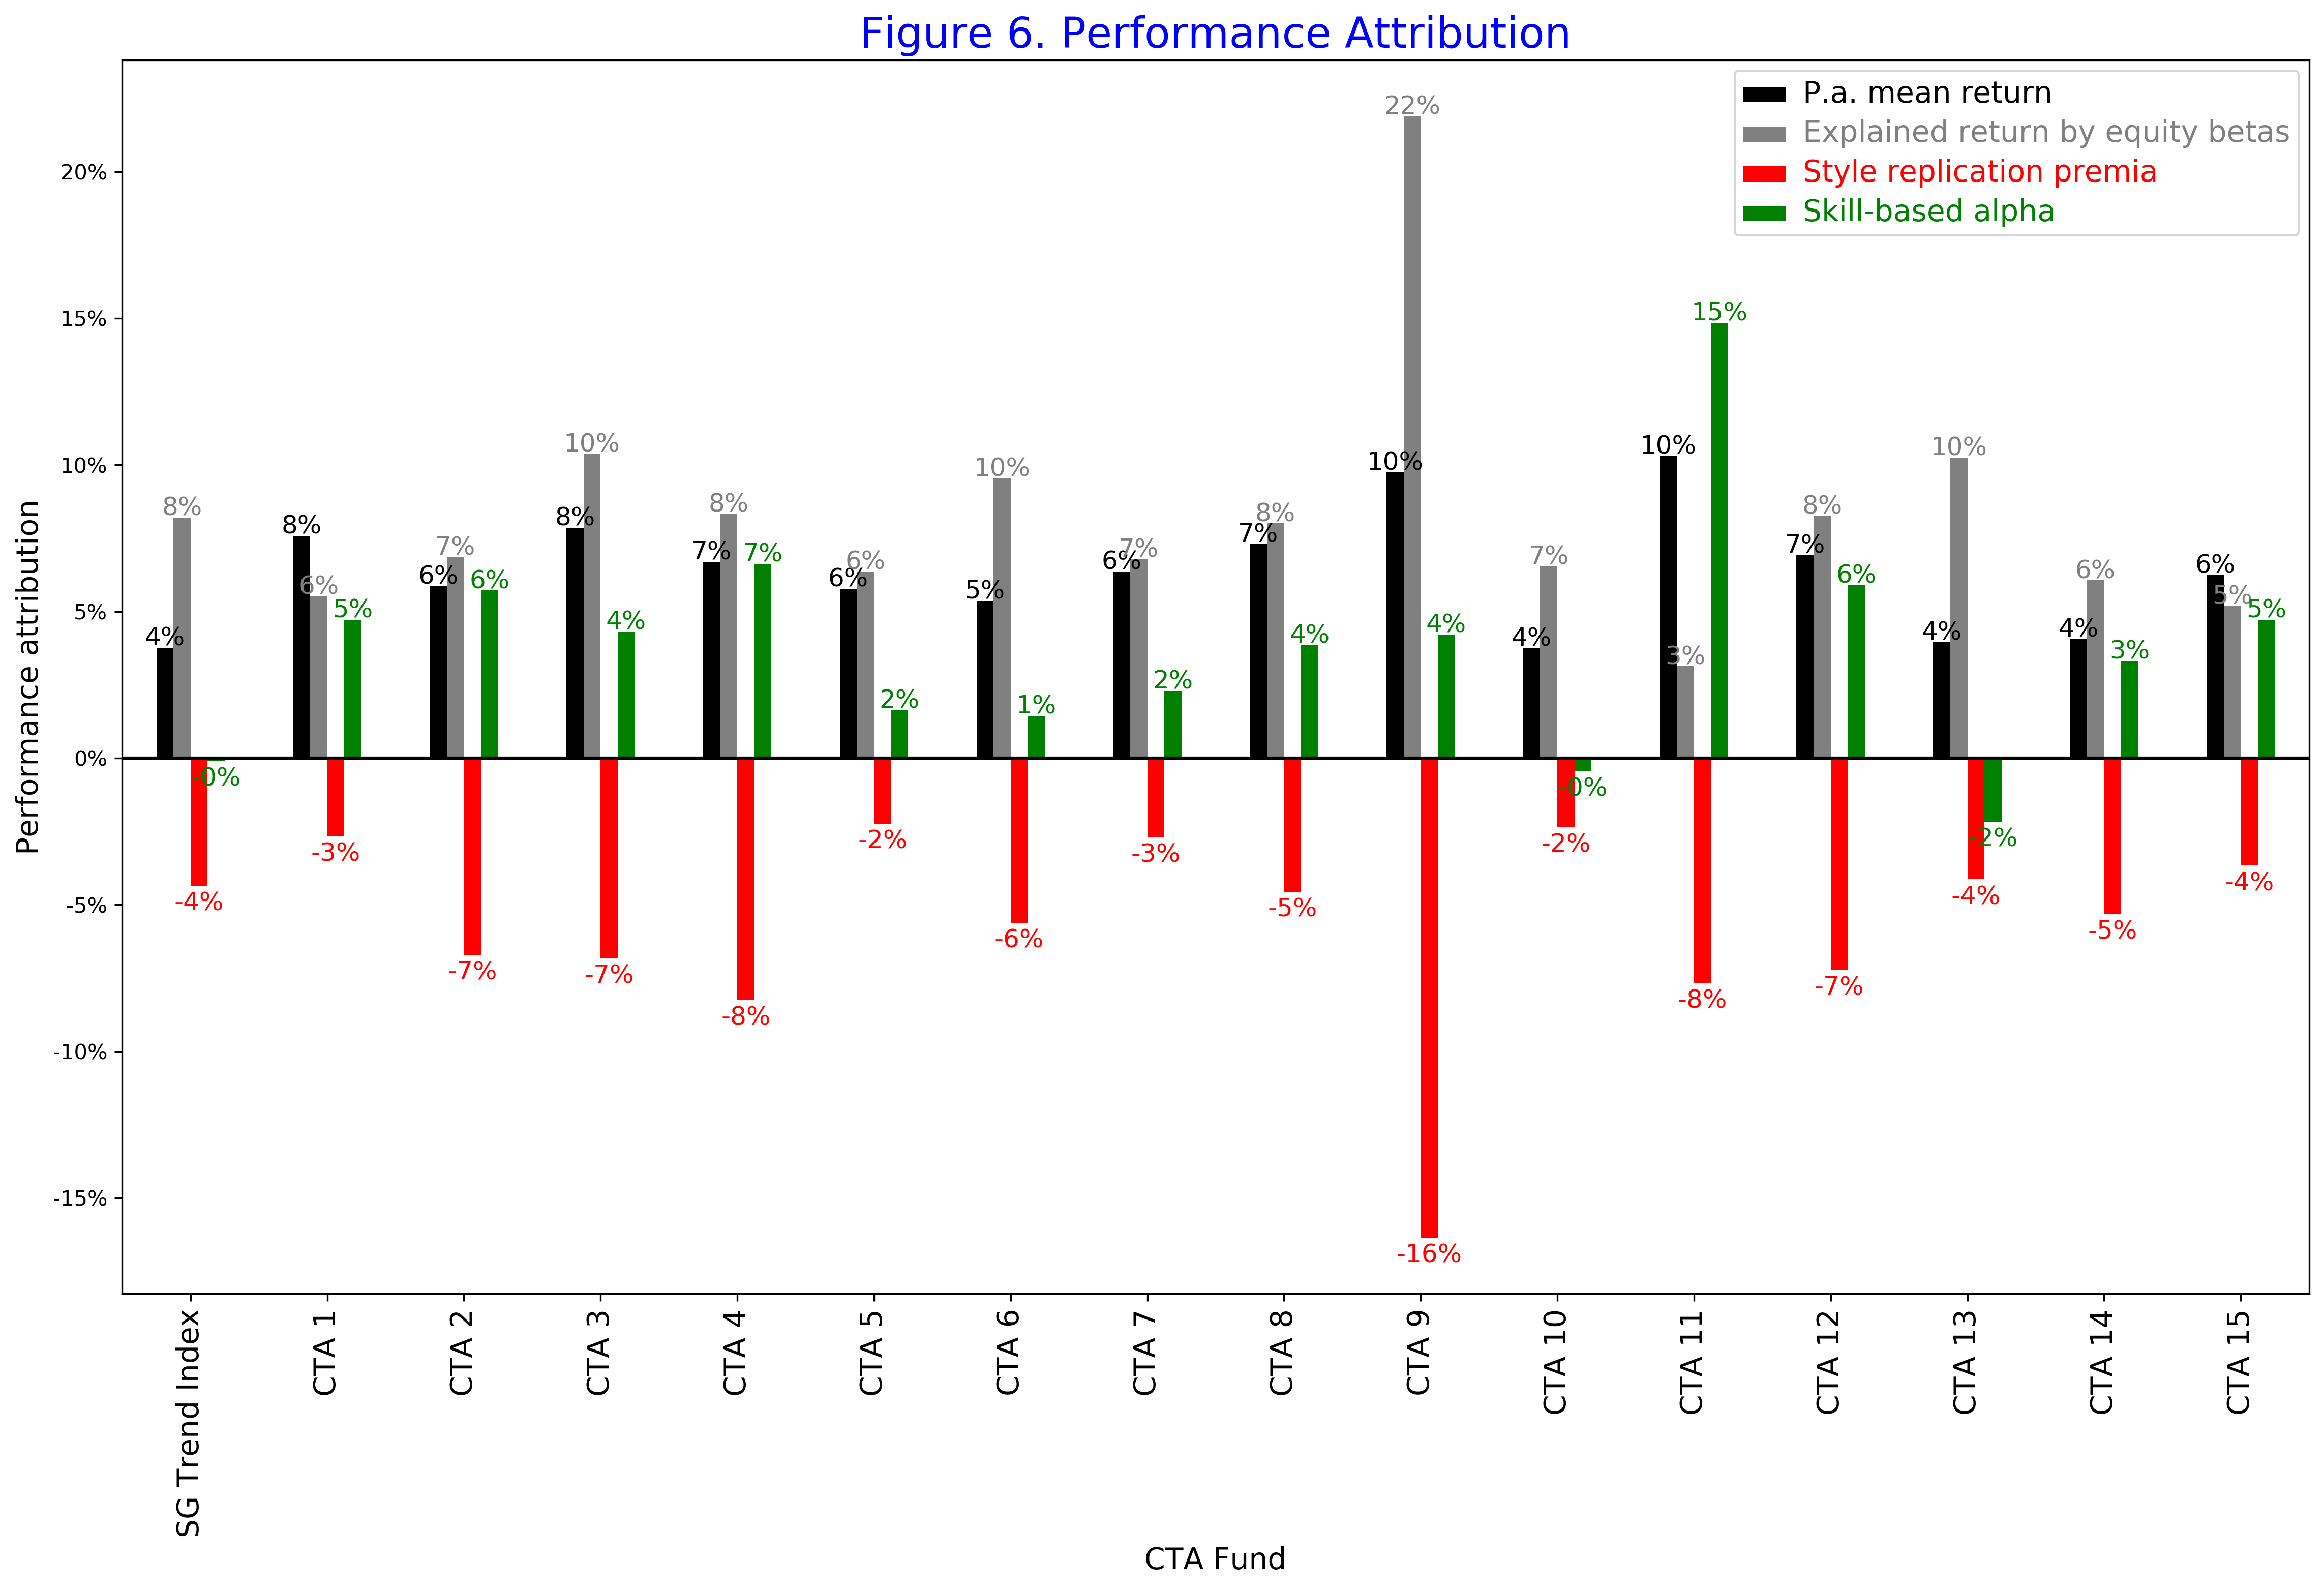
Using our equilibrium valuation kernel calibrated to the risk-premia alpha of the SG Trend Index, we evaluate the style replication premia for each of the CTA fund given their regime-conditional betas. In Figure 6, we show the performance attribution of CTA funds. The skill-based alpha of the SG Trend Index is zero by the construction.
We see that the style premia are negative for all the CTA funds. If a CTA fund has a large bear beta, its style replication costs are high. This is a result that if an investor would like to replicate the performance of this CTA fund using options, the expected roll costs would be high. Therefore, if a CTA manager can deliver the same convexity profile cheaper by active trading, the CTA manager would create positive skill-based alpha.
In our sample, we list some of the top performing CTA funds for the past 14 years, so their average skill-based alpha is positive. However, we see a significant dispersion with the lowest skill-based alpha of 0% to the highest alpha of +15%. Our methodology provides a robust way to estimate the skill-based alpha.

References
- Dao T.L., Nguyen T.T., Deremble C., Lemperiere Y., Bouchaud J.P. and M. Potters (2017) “Tail protection for long investors: trend convexity at work”, Journal of Investment Strategies 7(1), pp 61-84, https://arxiv.org/pdf/1607.02410.pdf
- Sepp A. and L. Dezeraud (2019), “Trend-Following CTAs vs Alternative Risk-Premia: Crisis beta vs risk-premia alpha”, The Hedge Fund Journal, 138, pp. 20-31, https://thehedgefundjournal.com/trend-following-ctas-vs-alternative-risk-premia/, https://ssrn.com/abstract=3368932
- Sepp A. (2019), “The convexity profile of systematic strategies and diversification benefits of trend-following strategies”, QuantMinds blog
About Artur Sepp
Artur Sepp is Director of Research at Quantica Capital AG in Zurich focusing on systematic data-driven trading strategies. Prior to this, Artur worked at Julius Baer in Zurich as Senior Quant Strategist developing algorithmic solutions and strategies for the wealth management and portfolio advisory. Before, Artur has worked in leading roles as a Front Office Quant Strategist for equity and credit derivatives trading at Bank of America Merrill Lynch in London and Merrill Lynch in New York since 2006. Artur’s research area and expertise are on econometric data analysis, statistical machine learning, and computational methods with their applications for quantitative trading strategies and asset allocation. He is the author and co-author of several research articles on quantitative finance published in key journals and he is known for his contributions to stochastic volatility and credit risk modelling. Artur has a PhD in Statistics from University of Tartu, an MSc in Industrial Engineering from Northwestern University, and a BA in Mathematical Economics from Tallinn University of Technology. He is a member of the editorial board of the Journal of Computational Finance.