Tracking real-world credit risk


With new threats like cyber risk and geopolitical instability stealing the limelight when it comes to thinking about risk management, it's important to still keep one eye on the ever pressing financial risk factors that bank's and financial services need to grapple with. Here, David Carruthers, Head Of Research at Credit Benchmark, looks at how grouping obligors into "baskets" could be a new solution.
Credit Benchmark collects anonymized credit data from major banks. This gives aggregate views of credit trends across a broad range of geographies, industries and borrower types. The company began to collect and publish monthly data in May 2015, so it is now possible to construct robust time series charts for a range of obligor types. Our latest white paper - “Bank-Sourced Credit Indices” - provides a number of examples, as well as a detailed description of the index methodology.
Traditionally, indices are built from a fixed set of constituents and this provides a like-for-like comparison of trends across time periods. This works well for standard groups of large borrowers, such as those that feature in the main equity and bond indices.
However, one of the key challenges in tracking bank-sourced credit trends for broader sectors lies in the frequent changes in the obligor mix within bank loan portfolios. Obligors may switch from one bank to another, or banks may adjust their exposures as part of their overall portfolio risk management. In addition, banks may also adjust their portfolios to reflect changes in the credit risk environment – by increasing their lending to higher risk names at times of a general improvement in the credit cycle.
One of the key challenges in tracking bank-sourced credit trends for broader sectors lies in the frequent changes in the obligor mix within bank loan portfolios.
To tackle these challenges, Credit Benchmark have adopted a modified version of the index construction methods used by the CDS market. This involves grouping obligors into “baskets” which are reset regularly – currently every three months. The basket approach gives a dynamic view of credit risk which adjusts for both survivor and selection bias. This view can be augmented by a traditional fixed constituent index for comparison.
Figure 1 shows the result of applying both approaches to a large set of US Oil & Gas obligors. (Note that the y-axis scale is inverted).
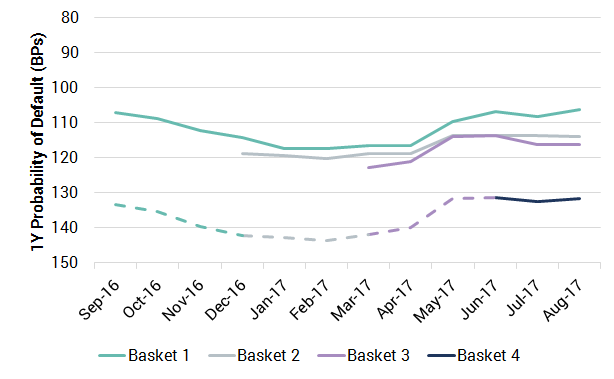 Figure 1: US Oil & Gas (Median Probability of Default)
The upper green line identified as “Basket 1” in Figure 1 is effectively a fixed constituent index, which in this case tracks the lower bound for the median PD. The short black line at bottom right, identified as “Basket 4”, is extrapolated backwards in time using the previous basket trends, rebased to the initial level for Basket 4. In this case, this shows the upper bound for the median PD.
The overall patterns of the upper and lower bounds are similar, with a peak in the median PD value around the start of 2017; since then, median credit quality has been rising. The bounds also provide a confidence range for the actual PD of the US Oil & Gas sector over this period. Figure 1 suggests that, for this sector, the range is +/- 10% of the PD level. Some other sectors show narrower ranges.
Indices like these provide the credit portfolio manager with a set of benchmarks along with suitable confidence intervals; they can select the level that is appropriate for their level of activity.
A stable and robust set of credit indices can also be used for covariance analysis, measuring the correlation between credit trends in different industries and geographies, as well as interactions with macro-level variables.
For example, the recently published white paper shows that:
- Median credit risks have declined for most of the major Corporate and Sovereign groups in the past 12 months.
- Over the same period, upgrades outnumber downgrades for most of the published indices, although in recent months downgrades have dominated for Sovereigns and some of the largest, traditional, US corporates.
- UK credit risk increased over the last 12 months, but has improved recently for the largest companies.
- Credit risks of Globally Systemically Important Banks and Central Counterparties are closely correlated.
The paper also shows how indices can be used to track the volatility of credit estimates. Credit volatility may provide a link between Through-the-Cycle and Point-in-Time estimates, especially where option-implied volatilities are not available. The latest data shows that credit volatility has been increasing over the past few months.
Research into credit indices will be a major focus for Credit Benchmark in 2018. We expect to publish regular updates on a growing list of standard and bespoke indices for use by credit portfolio managers.