How to forecast Covid-19 default and recovery rates

The Covid-19 health crisis has dramatically affected just about every aspect of the economy, including the transition from a record long benign credit cycle to a stressed one, with still uncertain dimensions. In this excerpt from the paper Covid-19 and the credit cycle by Ed Altman, Max L. Heine Professor of Finance, Stern School of Business, New York University, we find out how the forecasts of credit conditions changed.
Against this backdrop, we update our forecasts of credit conditions over the next twelve months. We estimate default rates on US dollar-denominated North American HY bonds using three different methods: the mortality rate approach, the required yield spread demanded by market investors and the distressed ratio method.
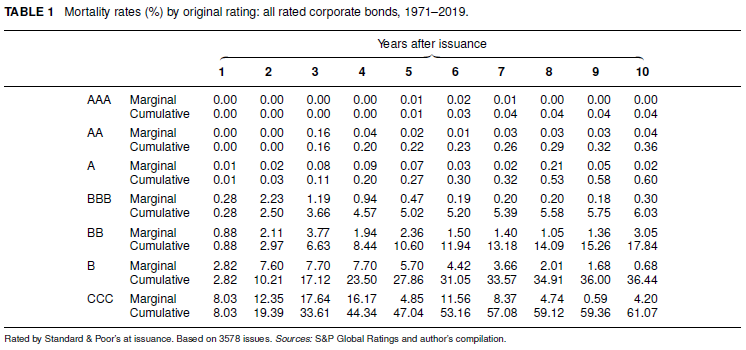
Mortality rate analytics (based on Altman (1989)) have been maintained and updated annually for thirty years. This actuarial technique records the frequency of default of newly issued bonds from every major rating category, including investment and noninvestment grades, for one to ten years after issuance. Our latest estimates cover 3578 corporate bond defaulting issues from 1971 to 2019 (Table 1). A similar analysis and compilation is done for mortality losses and can be used to estimate loss given default (LGD), which includes our observations of recovery rates on defaulting issues. These mortality statistics can be used to forecast default rates or probability of default (PD). The technique involves the impact of bond aging by adjusting the base population over time for other nondefault bond disappearances, such as bonds “called” by the issuer, maturities or merger-related activities. Thus, if we observe the US dollar amount of new issues by rating category for the past ten years and apply the marginal mortality rate estimates from Table 1, we can aggregate the amount of defaults in a subsequent year and then divide that into the forecasted population of HY bonds (as of the mid-year of the next twelve months) to obtain our first forecast of the annual default rate over the next twelve months.
Using the above mortality methodology, our forecast for the next twelve months as of December 31, 2019, was 5.75%. Note that we aggregate estimates based on all initial ratings, even investment-grade bonds. Since the last fifty years of default and new issuance data do not include a pandemic environment, and the number of crisis years was only about six out of fifty, our forecast of 2020 defaults will probably be on the low side. We prefer, however, not to ignore this actuarial method, especially since our other two methods do incorporate expectations based on current market conditions.
Our second and third techniques rely on the current yield spread in the market compared with ten-year Treasury bonds and the distress ratio. We started using the ten-year US Treasury bond benchmark before the market adopted a similar method, called the option-adjusted spread (the results of the two are very similar). The yield spread method observes the historical annual relationship between current (time-t) yield to maturity spreads and a default rate on HY bonds in t+1 (one year in the future). We update results annually, and the latest regression estimate is based on data from 1978–2018 yield spreads and 1979–2019 defaults, resulting in the following default rate estimate equation:
default rate(t+1)=-3.15+1.28(yield spread(t)), adjusted R2=59.6%.
Plugging in the yield spread of 9.84%, as of March 26, 2020, results in a next twelve-month forecast default rate of 9.45%. Note that due to extreme market volatility in late March and April 2020, the yield to maturity spread fluctuated from as low as 7.5% to about 11.0%, so our forecasted default rate is likewise volatile, depending on when the data is accessed.
Our final technique is the so-called distress ratio method, a measure we developed (Altman 1990) to assess the segment of the HY market that is most likely to default should either specific firms’ conditions and/or the real economy deteriorate significantly. Under these circumstances, default rates, in general, increase. We originally used the benchmark of 10% above the ten-year T-bond rate as our distress ratio criterion, but we have now adopted the market standard of 1000 bps above the comparable duration Treasury rate (the option-adjusted spread). Since 2000, this distress ratio’s median annual rate has been 10.35%, with an average ratio of 16.38%. This ratio has been as high as 81.2% (in December 2008) and as low as 1.62% (in December 2006).
Based on market data for 2000–18 for the distressed ratio and 2000–19 for default rates, our linear regression estimated equation is
Default rate(t+1)=0.923+0.240(distress ratio(t)), adjusted R2=75%.
R2 was not increased by using nonlinear estimates.
Plugging in the distress ratio of 33% as of March 26, 2019 (the ratio reached as high as 40.0% earlier in March and as low as 22% in early May), our PD estimate for the next twelve months is 8.84%. Averaging the three methods, our preliminary forecasted default rate for the twelve-month period as of March 2020 is 8.01%, which is about 2.4 times the comparable rate in 2019. Summarizing the results of the three models yields
mortality rate = 5:75%,
yield spread = 9:45%,
distress ratio = 8:84%,
average = 8:01%.
Finally, we have added a new element to our 2020 post-pandemic forecast, based on the huge increase in triple-B-rated debt and the likely “crowding-out” effect caused by the almost certain increase in downgrades to “junk” status, i.e., fallen angels. These downgrades, we posit, will have a negative impact on marginal firms’ ability to survive in a downturn (see further discussion in Section 3). This new factor, not considered in our historical time series models, will add perhaps an additional 1% to our forecasted default rate, bringing the forecast for 2020 to about 9%. This implies that the forecasted total US dollar amount of defaults would be US$135 billion in the post-pandemic period. For comparison, defaults in 2009 totalled US$123 billion.
Further, the estimated population of HY bonds at the beginning of 2020 was US$1.5 trillion. As of May 2020, the HY population had already swelled a fair amount based on increases from fallen angels and a significant amount of new issues, especially in January/February and April/May, even net of defaults. Admittedly, the triple-B-related element added to the forecast default rate is somewhat arbitrary, but to ignore it would, we feel, be an oversight. Forecasting an increase in defaults due to the crowding-out effect of BBB downgrades is a tricky exercise.
We are cognizant that both the numerator and denominator in the default rate calculation will be increased by fallen angels. Already, between March and mid-May 2020, about 18 BBB issuers were downgraded to junk-bond status, amounting to about US$150 billion face value. So, while there will no doubt be an increase in default amounts due to any crowding-out effects, it is not clear if the default rate will increase; it depends on the timing of the downgrades and the consequent increase in the HY bond population compared with the increase in new defaults. We clearly expect that the default rate for the first half of 2020 will increase, since the HY population base will only be impacted by first-half-year fallen angels. For all of 2020, however, the mid-year population base, which is our annual default rate benchmark, will be more widely affected. In summary, we are comfortable with our fallen angel default rate estimated adjustment of +1% over the next twelve months (until May 2021).
During the pandemic, financial markets have witnessed unprecedented short-term volatility in both equity and debt markets. A related consequence is that default rate forecasts which partially depend on market conditions will have a good deal of volatility, even from month to month. To indicate this, our recent next-twelve-month default rate forecasts based on an average of our three methods plus the adjustment factor have fluctuated from 4.6% as of the end of 2019 to 9.0% as of March 26, 2020, and to 8.6% as of May 15, 2020. As of the end of May, the preliminary calculation of default rates, year to date (YTD), is about 2.33%, based on about US$35 billion of defaults.
Join Ed Altman at RiskMinds Americas this September and find out more about what else has changed in risk management.

Covid-19 and the credit cycle was first published in the Journal of Credit Risk. Access the whole paper >>
For more related content, check out Ed Altman's book "Corporate Financial, Distress, restructuring, and bankruptcy", Fourth Edition, John Wiley and Sons.