
IGM Global Credit Snapshot – March 2023
11 April 2023 | Gavin Kendrick
A monthly trend analysis of the European, US and APAC markets
Banking fears keep a lid on issuance but Europe still manages to reach a record quarterly tally
Following an all-time record month in January, and the busiest ever February, the EUR bond market fell victim to rampant volatility in March that slowed bond issuance globally. Overall volumes fell by almost 39%, but still topped the EUR100bn mark
The APAC USD primary bond market also fell foul of the volatility attested to above but encouragingly did bounce back in the final week of the month. Despite a firm lid on benchmark issuance for a prolonged period, a total of USD13.288bn (incl. Japan) of supply made it over the line, which was a decline from the USD19.357bn that materialised in February.
In the US, ex-SSA volume for March 2023 came in at USD101.04bn. This tally marked the second slowest ex-SSA issuance March of the last decade, with the last three Marches all producing over USD200bn in new issuance. Despite a slow March the quarter finished as the 4th highest issuance Q1 on record. 2023 is trailing 2022 by 12.6% with the Street expecting an 8.3% increase in issuance from 2022's USD1.21tn.
European Credit Issuance Trends

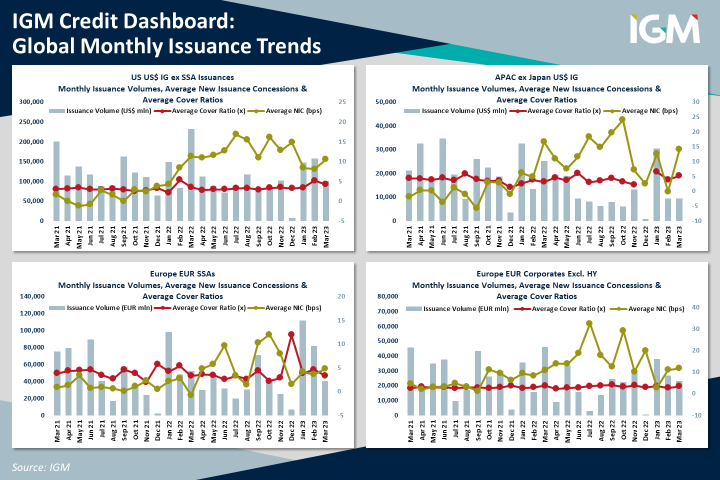
Following an all-time record month in January, and the busiest ever February, the single-currency bond market fell victim to rampant volatility in March, with overall MoM volumes falling by almost 39% to EUR100.851bn. The collapse of SVB, generalised angst regarding previously unidentified losses in banks' balance sheets, and fallout from the shotgun wedding between Credit Suisse as UBS sent shockwaves through markets with the scramble for havens sending yields plunging and market players racing to cut rate hike bets. With banks at the centre of the volatility, non-covered FIG saw a near 40% MoM drop in activity but it was SSAs which witnessed the biggest slowdown as sovereigns mostly opted to stay away with volume more than halving compared to February. Thanks to the bumper first two months of the year, the all-asset class total raised in Q1 was still enough to make it the highest volume quarter ever though.
IG Corporates (ex-HY): Heightened volatility kept a lid on EUR IG corporate bond activity in the latest month with the supply haul for March finishing at just EUR23.084bn. That marked the slowest March for the asset class since 2012 and a decrease from Feb's EUR26.85bn total, with the middle two-weeks of the month only seeing a couple of trades amid the SVB collapse and associated fallout. The riskier hybrid market stayed devoid of benchmark euro issuance for a second consecutive month amid the souring tone. Despite uncertainty, investors were keen to put their cash to work with March's deals covered on average 3.34x compared to 2.74x in Feb. That came with NICs remaining elevated though, at an average 11.73bps in March versus a slightly lower 11.01bps the previous month.
FIG (ex-covered): The new month started where the old one left off with CaixaBank becoming the ninth bank this year to bring a euro AT1. However, the music stopped for banks on 9th March when Intesa Sanpaolo and UBS tapped a market that was already succumbing to systemic worries centered around SVB which formally collapsed a day later, with Credit Suisse then being absorbed by UBS the following weekend. Against that backdrop, the unsecured FIG market remained closed to banks for the rest of the month. The amount raised was also nearly 40% below the corresponding month of 2022.
Covered: Despite a two-week long drought during the middle part of the month due to fallout stemming from drama surrounding SVB and Credit Suisse, total issuance came to EUR19.845bn - exceeding the EUR14.5bn of redemptions due in March. For comparison, an average of EUR14.576bn has been issued during March over the past five years. While new issue concessions more than halved from January to February, borrowers in March paid up for funding, paying an average NIC of 4.59bp to be precise – more than double February's 2.36bp.
SSA: As mentioned above the SSA sector bore the brunt of the volatility induced slowdown that characterised March. The month had started with some promise with EUR15.3bn being placed before the 9th of the month, but then only EUR2bn (made up of small German taps and an LSA deal) crossed the line until the 28th of March, when the EU reopened the market with a EUR6bn tap of the Feb-2048 green bond. Sovereigns were almost completely absent for the entire period with just North Macedonia (returning on 6th March after an earlier cancelled deal) and Greece (5yr issued after EU tap) braving the capital markets. IGM's key metrics showed the general unease with the average NIC increasing to 4.75bp from 3.64bp in the prior month (although that remained below the 2022 average of 5.07bp) whilst coverage weakened to 3.35x (4.6x in February and 2022 average of 4.15x).
APAC Credit Issuance Trends
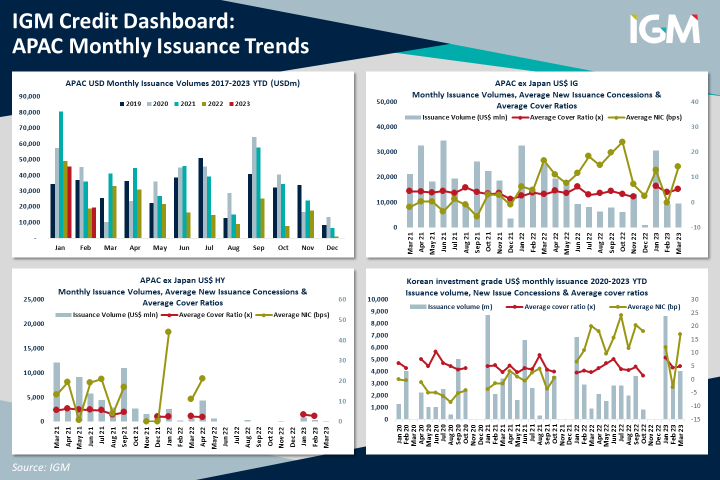
The APAC USD primary bond market bounced back in the final week of March 2023 to end an otherwise challenging month. Heightened broader market volatility amid turbulence in the banking sector kept a firm lid on benchmark issuance for a prolonged period. Just USD13.288bn of supply made it over the line in total (incl. Japan), a decline from the USD19.357bn that materialized in February. That also marked the lowest month of March in terms of issuance volume since the initial covid wave paralysed the primary market back in March 2020, in what has traditionally been one of the busiest months of the year.
Investment grade (IG) issuers led by example once again, accounting for USD12.5bn or over 94% of the overall monthly haul (incl Japan), which was broadly met with an encouraging response from investors who proved keen to add exposure to regional names at the right price. That was highlighted by the healthy average cover ratio for March's IG deals which came in at 5.42x, up from 3.74x the previous month.
Issuers had to take a pragmatic approach to pricing to persuade cautious investors to part with their cash, especially in the final week of the month, when benchmark issuance resumed after twelve back-to-back sessions of inactivity. That was reflected by the average new issue concession (NIC) that spiked to 10.57bp, up from 4.5bp on average in the trevious month, although it was still down on the average 11.81bp NIC paid by APAC USD IG issuers in January 2023.
From a geographical perspective, Korean issuers continued to provide a notable contribution in March 2023 at USD4bn which equates to over 30% of the overall issuance total. Those issuers that dipped their toe in the water were embraced by investors to varying degrees, once again aided by eye-catching NICs, the average of which rose to 17bp which was up sharply from the -3bp (negative) the month before. That supported a solid cover ratio on March's IG Korean issues of 4.85x, up from 4.42x the month prior.
High yield issuance remained muted in March 2023, although the month wasn't a complete washout thanks to a sub-benchmark USD175m 3yr line from Chinese LGFV Chengdu Aerotropolis City Development Group Co., Ltd. That total fell from the USD300m of high yield supply in February and the USD850m of regional HY issuance that made it over the line in January 2023.
US Credit Issuance Trends
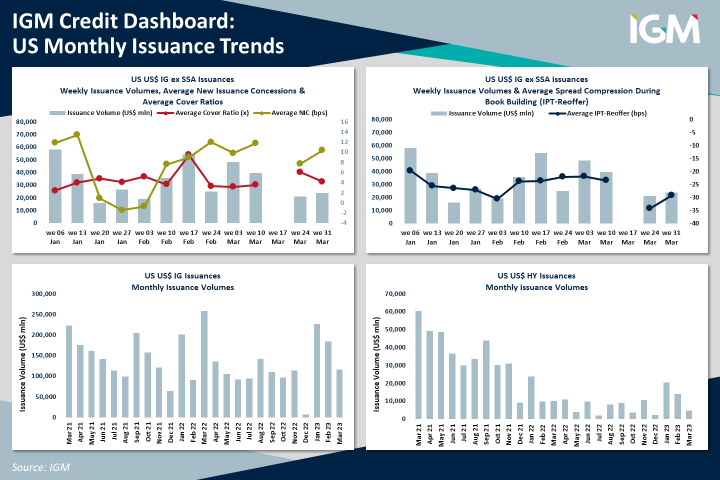
Ex-SSA volume for March 2023 came in at USD101.04bn. This tally marked the second slowest ex-SSA issuance March of the last decade – a number which must be seen within the context of March being known as one of, if not, the busiest ex-SSA issuance month of the year. Over the last decade, the month of March has averaged USD150.7bn in ex-SSA issuance volume, ranking it as the busiest issuance month of any year. Overall issuance in March was USD115.79bn vs. an average forecast of USD185bn, a low-end estimate of USD135bn, and a high-end estimate of USD230bn.
Although the last three Marches all produced over USD200bn in new issuance (USD258.72bn, USD201.2bn and USD231.9bn), March 2023 was not your typical March. Volatility caused by the uncertainty surrounding the Fed's interest rate policy, nagging inflation and a near banking crisis forced many prospective borrowers to the sidelines for most of the month waiting for the dust to settle.
While March numbers fell short of forecasts, they, along with a record in February (USD156.65bn – the most prolific issuance February in history), resulted in issuance of USD405.59bn in Q1 – the fourth-highest issuance Q1 on record and the busiest quarter since the first quarter of 2022 (USD463.841bn). Year-to-date, 2023 is trailing 2022 by 12.6%, while at the start of 2023, the Street expected an 8.3% increase in issuance from 2022's USD1.21tn.
In terms of sectors, Industrials topped March issuance with USD38.65bn (33.38%). The sector which produced the least volume was Yankee Industrials (USD11.5bn, or 11.3%).
For April, the Street was looking at an overall issuance tally averaging USD135bn. The lowest estimate came in at USD90bn, while the highest estimate came in at USD150bn. Ex-SSA, the lowest estimate was USD70bn, while the highest was USD125bn and the average was USD100bn.
As for the prospects of issuance in the month of April, a month that falls just above the middle of the pack (#5) when it comes to issuance, the outlook is rather promising. The 10yr average ex-SSA volume for April comes in at USD120.919bn, with as little as USD87.5bn pricing in 2016, and as much as USD290.63bn, the monthly issuance record, and we all know why, coming to market in 2020.
In the US High Yield space, the quarter ended with upward momentum, despite primary market issuance falling away for most of March 2023. Quarterly issuance was USD39.02bn but has dwindled in each month of 2023, falling by 46.09% from January to February and with March volumes representing only 35% of that seen in February.