Listening to the financial heartbeat with agent-based models

Time, as they say, is of essence in the financial world. Every second counts. But the reality is that the economic system in which the finance sector operates is not constricted by our traditional perceptions of time, nor is it a black-and-white world where price monitoring only can keep you afloat. In this article, Vladimir Petrov, PhD research fellow of Marie Sklodowska-Curie initiative BigDataFinance at the University of Zurich, and Anton Golub, Founder and CEO of flov technologies, explore agent-based models in directional-change intrinsic time to help navigate this increasingly unpredictable economy.
Imagine you are a seasoned professional trader.
You start the morning by sitting in a soft chair, sipping fresh coffee, and reading the latest news. You have cultivated the habit of regularly checking the Dow Jones Industrial Average, or simply Dow, and you check the financial index this morning too. You are not a newbie in the trading world. You can freely read tiny market signals, and you have not seen anything suspicious for the past several days. It seems like it is going to be a dull day too.
In your office, traditionally called the “trading floor”, it is no louder than in a library. Without much work, you get bored. It is about 2pm, and you decide to go for a late lunch.
Before eating, you briefly pull up the smartphone to check Dow. A slight descent of the index caught your attention. No problem, it has no significant gravity. In your extensive career, you have seen severe price fluctuations, and this decline doesn’t compare to any of them.
On your way back, you check Dow again. Great news! The index is slightly down compared to the value you saw prior to the lunch. It is nothing especially impressive, but at least you will have something to do in the office now.
However, entering the trading floor, you find your colleagues speaking astonishingly loudly over their phones! No doubt, something essential has just happened. But what could it be? It is certainly not connected to Dow since you have been closely monitoring it all this time, is it? You rush to your desk to turn the screen on and what you see, shocks you.
In the 50 minutes you weren’t watching the index, it experienced a deadly roller-coaster. In a matter of minutes, Dow encountered the biggest intraday decline in the entire history. A few minutes more and the index bounced back. Now you know how invaluable that one-number information was on your phone before and right after the break…
This severe price fluctuation resulted in more than a trillion dollars temporarily lost in the stock market. A vast number of trading positions were liquidated, causing an irreparable loss for individuals and financial institutions. The event you have just observed will be later called Flash Crash, May 6th, 2010.
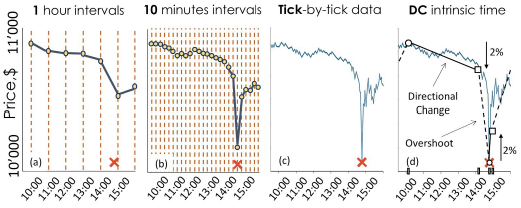
Figure 1. The Dow Jones Industrial Average on May 6, 2010 (10:00 AM - 4:00 PM EDT). Time series composed of one hour time intervals (where the most important information of the event, its depth, is not efficiently captured) (a), ten minutes (where one of the records is close to the bottom of the crash, however, the substantial number of redundant measurements is performed when the market is relatively stable) (b), tick-by-tick data (which is not convenient to work with as it is indicated in the text) (c), and the price curve dissected by the directional-change framework with the threshold size equal to 2% (where only four records were enough to capture the bottom of the flash crash) (d).
Intrinsic time
Multiple investigations were performed later to understand the origin of that financial disaster. Various speculative versions were proposed, from the fat-finger theory (some big organisation mistakenly submitted a massive trade) to a technical glitch. There are still discussions on what exactly went wrong on that fatal day. The actual reason will probably never be revealed. But one fact is clear: the Flash Crash was triggered by a sequence and an intricate combination of particular events which may have been political, environmental, and/ or social – we may never find out exactly.
It is naïve to expect that one could observe each of these phenomenal events by stringently checking the market periodically. The clock hand, diligently counting periods, does not dictate when the phenomenon should burst. Therefore, recurrent market observations can be utterly confusing. Struggles to record price fluctuations over regular intervals are equivalent to the struggles of taking a sharp photo of a lightning by taking one picture every minute. One has to be extremely lucky to pull the shutter at the precise moment when the lightning blasts.
Our fictional trader from the beginning of this story missed one of the most significant events in the entire history of finance. The trader falsely assumed that the market is evolving over regular physical time intervals. However, the conventions accepted in the world of physics do not wholly reign in the economic environment. The second, so commonly used as a measure of time in physics, is officially defined as over nine billion oscillation of a tiny caesium atom (precisely 9,192,631,770 oscillations). The scientist simply agreed that one second elapses after every series of such swings. It is hardly practicable to imagine that financially related events would count the atom moves while deciding when to happen.
One might think that if the trader consulted the phone at a higher periodicity, he would not have missed the moment of the crash. Indeed, referring to the market with higher regularity increases the chances of having one of the observations closer to the crash. However, too many observations inevitably require too many resources. Also, the produced data becomes polluted by useless measures (see Figure 1 for an example of how the Flash Crash looks like over regular 1-hour and 10-minute time intervals). That is similar to filming the lightning using a super-speed video camera: such cameras are successful in capturing swift events but are extremely expensive and need exceptional treatment.
Visual scientists came up with an elegant solution: they developed an event-based vision. Cameras, equipped with such vision, continuously observe the examined object but do not produce any data until the critical change or phenomena happens. As a result, the most vital information is still collected, whenever no irrelevant data is produced.
Similar to visual scientists, quantitative researchers suggested various financial frameworks designed to circumvent the stiffness of the periodic time. Some frameworks consider a particular accumulated trading volume as an intrinsic event. Other frameworks advise referring to the number of trades as the intrinsic time counter.
One of the proposed alternatives to the calendar time in finance stands out from the rest. The framework, called directional-change intrinsic time. It does not rely on the number of trades since they all can have different volume. It neither concerns the trading volume since the number of trades is not constant. Instead, the approach relies on the price curve as the only bearer of the financially important information. Nothing but the alternating price moves of the particular size signal when the observation has to be made.
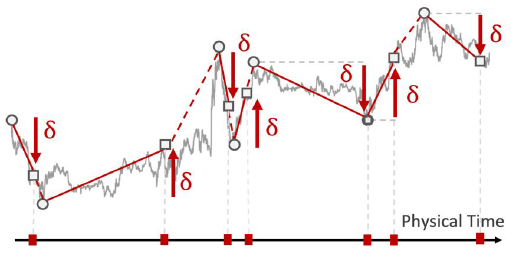
Figure 2. A price curve dissected into a sequence of alternating directional changes of size
Now, the trap associated with the periodical market observations can be avoided. A trader can employ the directional-change framework to be notified about any price swing of the decided size independently on when the swing occurs. For example, as a high-frequency trader, he might prefer to know about any tiny price oscillation occurring several times per minute. By selecting small thresholds for the framework, he can easily achieve the goal. Alternatively, as a long-term investor, he might not want to be bothered about little market disturbances. Selecting large directional-change thresholds will keep him calm and yet informed about significant market trend shifts. Moreover, the trader might never like to miss a small decline while staying ignorant of the increases. In this case, he is free to choose different scales for the directional changes – upward and downward.
Agent-based model
Scholars have always been curious to know what drives the traders' decisions. They proposed a wide range of agent-based models to disentangle the observed “price changes – market participants react” phenomenon. The models represent complex systems populated by a large number of heterogeneous traders mimicking real traders’ behaviour.
Despite the manifold of the agent-based models, there was no one which would be designed to perform in directional-change intrinsic time. We decided to fill the gap and started building our agent-based model in a very special way.
It is crucial how the agents’ behaviour is defined in the models. As discussed above, real traders are rarely concerned about the flow of time. Instead, they watch market disturbances. There is an uncountable number of different types of traders in the real world. There are high-frequency traders who rapidly react to any price fluctuations as well as long-term investors who keep their funds untouched until something significant disturbs the market. We used this knowledge to build heterogeneous artificial agents which are not similar to each other. We can simulate this diversity by employing the directional-change intrinsic time concept. Thus, we equipped each simulated agent with a pair of unique directional-change thresholds which can be used to dissect a price curve into a sequence of price moves of different scale.
The aggregated trading activity of the vast number of traders continually impacts market price changes. As two boxers dancing in the ring and exchanging punches, traders and the price rhythmically react to each other. In boxing, one fighter starts by making a light punch towards his opponent. He does not try to crush him. Instead, he tests the reaction. The opponent dodges, evaluates the strength of the punch, and counteracts. The dodging and response vary in speed as well as in intensity. Sometimes even a strong punch cannot break the defence, but another time, a light touch can lay the opponent flat on the shoulder blades.
Similarly, price changes are induced by trades, and trades are caused by price fluctuations. The mismatch between supply and demand is the trigger of the price correction. After the correction, the agents perform another series of trades. The price changes yet again (probably at a different scale) causing another demand/ supply imbalance, which induces a price change, which affects the trader's decisions, et cetera. This signal-response-signal-… logic was utilised in our research as the price-generating machine.
Once the set of diverse agents is prepared, it is time to revive the trading. First, we made a small "punch" by supplying the agents with a tiny price shift. They evaluate the shift from the intrinsic time perspective: each of them checks whether the scale of the price change is sufficient to trigger an intrinsic event or not. Those who register events, make trading decisions. Some of them select to buy when others choose to sell. As soon as all agents are asked about their choices, the price corrects its value to reflect the supply-demand imbalance (more details on the exact formula can be found in the original paper by Petrov, Golub and Olsen). The price swing serves as the new input for the agents and the procedure continues. As external observers, we collect the generated changes and form a time series.
Validation
We calculated mathematical statistics of the generated time series and compared them to the statistics of the real Foreign Exchange (Forex) market. The discovery was impressive: our naïve agent-based model produced price changes close to the ones observed in the real world. It is worth highlighting: the model has no memory, the agents do not interact with each other, and they do not comprehend any news announcements. The only source of information is the market price. The price, fluctuations of which are interpreted in the directional-change intrinsic time.
The simplicity of the model suggests that real traders intentionally or unintentionally perceive the price evolution in the directional-change intrinsic time, and their perception is independent of the physical flow of time.
It is essential to understand the market structure clearly. The knowledge of the structure helps to identify the market weaknesses and flows. Knowing the flaws, one can develop efficient tools to strengthen the system. These tools will not allow the next financial crash similar to the Dow roller-coaster to irreversibly hurt the well-prepared trading world.

This article is a part of the series on the directional-change intrinsic time in finance. Our previous two publications are available:
In the future, we are going to outline concerns over the extension of directional-change intrinsic time to the multidimensional space. Stay tuned!
This article is based on the research paper Agent-Based Model in Directional-Change Intrinsic Time by Petrov, Golub, and Olsen