Painting the picture of private equity fundraising in 2018

Although the private equity fundraisers had enjoyed a successful year with a booming market in 2017, are we on course for another promising year? Kelly DePonte, Managing Director at Probitas Partners, takes us through the data behind the scenes to give us a taste of what’s to come in 2018.
Anyone with a cursory interest in private equity fundraising knows by this time that the market hit a new global high in 2017, and many are expecting that 2018 will be a vibrant market by extrapolating last year’s success. But a closer look at long term trends (Chart I) paints a much more nuanced picture.
Over the last 18 years the largest private equity market, North America, demonstrates very distinct peaks and troughs, with low points in the wake of the bursting of the Internet and the start of the Great Financial Crisis (“GFC”) and peaks in 2007 and 2017.
There is a similar pattern in European private equity, another market heavily driven by buyouts, while the Asian market seems to be more volatile year to year, with the long-term trend being up and to the right.
The caveat here is that most of the European funds are denominated in Euros and Pounds, while many funds in Asia are denominated in RMB or Yen. To compare these funds globally all those amounts are translated into U.S. dollars, but that is likely adding some noise to the annual comparisons.
Emerging markets beyond Asia are a small fraction of global fundraising and do not move the needle much.
In addition, the numbers in Chart I are focused on closed-end funds. Since the GFC, the importance of co-investments, separate accounts and direct investments has increased significantly even as they remain difficult to track accurately. The total amount of money targeting private equity, especially over the last seven or eight years, is very much understated.
Trend watching through North America
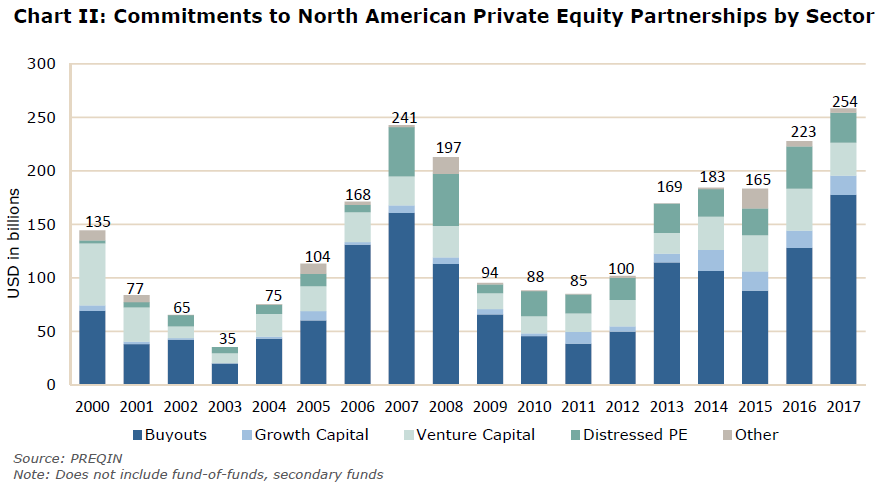
Since North America is the largest private equity market, it is useful to drill down and take a deeper look at the trends in the underlying sectors of the market.
In every year except for 2000, buyouts dominated fundraising; in 2000, venture capital nearly matched fundraising at the top of the Internet Bubble, but venture has not come close to matching that total since.
Distressed private equity — which includes distressed debt, special situations and turnarounds — is distinctly countercyclical, with fundraising increasing significantly when investors anticipate a market correction is coming. That is evident in the peak fundraising years of 2007 and 2008. 2016 and 2017 were also strong fundraising years for distressed, though not matching the pre-GFC highs.
The surge of 2017 fundraising in North America was driven by 38% increase in buyout fundraising, driven by mega-funds (some of whom invest globally and not just in North America) and middle market buyouts as all other sectors declined or remained flat.
Where in private equity are people investing in?
Going beyond history, we also asked investors in our annual survey what their investment plans were as we moved into 2018. Most respondents were focused on investing more in private equity this year, and details of the sectors they are targeting follow in Chart III.
During 2018, my firm or my clients plan to focus most of our attention on investing in the following sectors (choose no more than seven):
Out of a wide range of potential targets, institutional investor respondents our survey where most focused on buyouts and growth in the U.S. and Europe, with a tilt towards middle market focused funds. Besides these strategies, only U.S. Venture Capital and Special Situations funds cracked the top eight slots in the rankings. It should be noted that the survey was global, and though there were some differences by the geography of the respondent, the heavy focus on developed market buyouts was common across the board.
Given the heavy focus in the markets on buyouts, besides simply extending the fundraising trend line, is there other data we should be tracking?
Key metrics: buyout metrics and dry powder
Purchase prices for buyouts are a key metric that is readily available, with higher prices paid on average putting pressure on returns in the long run. Chart IV tracks average purchase price multiples for U.S. buyouts, the deepest market, which shows a cyclical long-term trend similar to fund raising trends in Chart II, but with important differences:
- In the large buyout market, multiples are now significant higher than they were in 2007, not just edging over the 2007 peak as fundraising is doing.
- Middle market buyouts purchase price multiples are usually lower than multiples at the large end of the market. However, the gap between the two has widened substantially over the last two years as competition intensifies for larger deals.
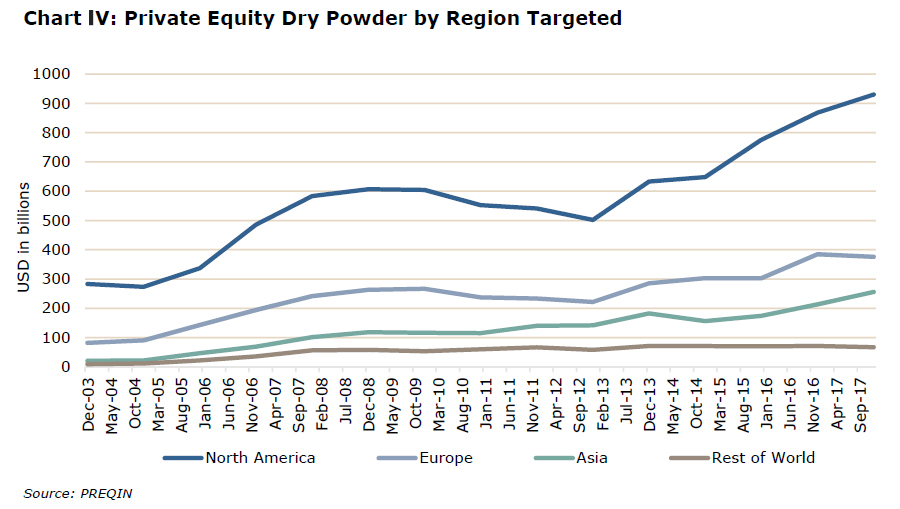
Another metric of interest is capital overhang or “dry powder” waiting to be invested. Very high levels of dry powder can add pressure on fund managers to deploy capital even in a very competitive environment where purchase price multiples are high. Chart V shows that dry powder in all three major geographies is at an all-time, though there are nuances to the data not obvious from a cursory look:
- As with the fundraising data, the information here is focused on capital committed to closed-end funds and does not cover capital on the side-lines targeting co-investments.
- Asia is a newer market that private equity has just begun to penetrate over the last decade. In addition, China, the largest market in Asia, has an economy that is growing rapidly, much faster than the developed markets of North America and Europe. With the growth of private equity in Asia balanced by those two factors, one would expect dry powder targeting Asia to naturally be increasing.
- The region with the strongest growth in dry powder over the last three years is North America, to numbers substantially above its 2008 peak. That increase has been focused on buyout strategies.
There are two caveats here. One would expect over time that dry powder numbers would grow due to economic expansion, even in a market where private equity penetration is already strong. But as was stated earlier, without taking account of co-investment capital waiting on the sidelines to be invested these numbers are understated. The other caveat is that as with the fundraising totals, a few of the largest North American funds invest globally.
Where do we stand overall?
Many institutional investors are concerned that we are at or near the top of a market cycle given some of the danger signals mentioned. However, they also feel that in a market where central banks have put pressure on returns across the board, potential private equity returns are still attractive compared to other investment options.
In addition, they realize that when the market cycle turns purchase price multiples will fall and that new private equity investments will be made at attractive prices — something they do not want to miss. And those with long experience know that correctly predicting when a market will turn or what the trigger event will be is nearly impossible.


