Seeking alpha? Size, specialisation and complexity matter

The U.S. has been in one of the longest expansionary periods in history. Stock markets, private equity valuations and leverage levels in the larger, more efficient markets have continued to surpass their prior all-time highs. What can we learn from the last recession? How can one look for excess returns relative to risk? How can one prepare a portfolio to withstand volatility including with more protective and less correlated investments?
Trends and where to find alpha in a heated market
A reminder from the last recession is that many investors chased returns in highly efficient and leveraged markets, many of which resulted in substantial losses and even the demise of long-established and high-quality institutions. There have been worries of the next recession for many years and many major risk indicators are flashing red.
If you are concerned that a recession could be coming, one might consider more defensive, lower leveraged loan funds, as well as assets that are less correlated to your broader portfolio.
Here we will focus on a market segment that has produced substantial excess return relative to risk, otherwise known as “Alpha” as well as data-driven analysis of the largest drivers of risk in credit markets. As we saw in the last recession, just because many people are doing something, doesn’t mean it is safe.
Correlation
As globalization continues, at some level, most things have some degree of correlation. Consider your smartphone, freezer and thermostat – despite differences in purpose, each relies on electricity from the same grid to power core elements of our everyday life. How would a blackout impact their function – and for what length of time could we tolerate their absence? Correlation to a common nexus is a critical area of analysis for alternatives investors as they select assets and engineer portfolios.
Discussing the relationship of assets to the larger market, industry professionals typically reference “Beta”, the measure of an asset’s exposure to general market movements – as opposed to factors indigenous to the asset itself. When we contemplate Beta, investors must answer fundamental questions of risk tolerance and market confidence: how much exposure can your portfolio tolerate – and for how long?
The case for lower-correlation assets and portfolios is not a new one – the 2008 financial crisis is just the most recent example of the risks that accompany having too many “eggs” in one, heavily correlated, “basket”. Firms and investors with substantial exposure to the larger market (higher Beta) experienced significant pain as heavily correlated, interdependent industries and investments faltered in the 2008 financial crisis. However, when the public equity markets have been booming – as we’ve seen over the past decade, it is hard for many to stay out of the flow.
Private capital has grown at an unprecedented rate – approaching $2 trillion of investable capital (often referred to as “dry powder”) at the end of 2018.
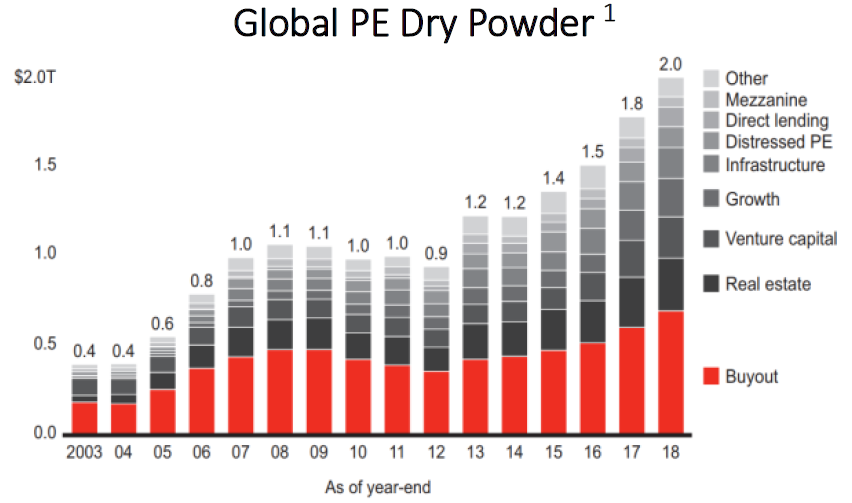
With these capital inflows, supply and demand have helped drive changes to equity valuations and leverage levels.
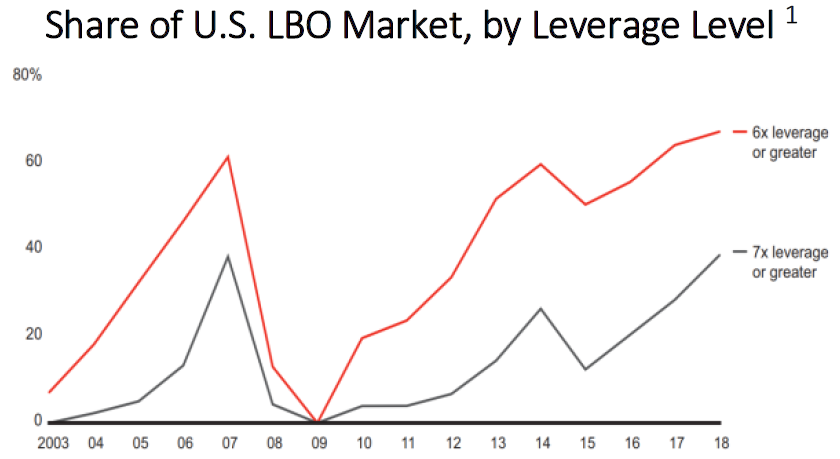
Since 2010, the share of buyouts with > 6.0x leverage has risen to 60%+, with nearly 40% of deals closing above 7.0x.
The U.S. LMM private credit space
Some investors would say that a rising tide lifts all boats – however, not all markets have benefitted equally from these inflows of capital. Since 2008, regulations imposed on many primary lenders have created a supply-demand imbalance of capital for small and medium-sized businesses, as institutions have shifted away from cash-flow and enterprise value-based loans and pivoted to focus on larger public markets. This has been especially prevalent in the U.S. Lower Middle Market – which consists of ~200,000 companies with between $10 and $150 million of annual revenue.2
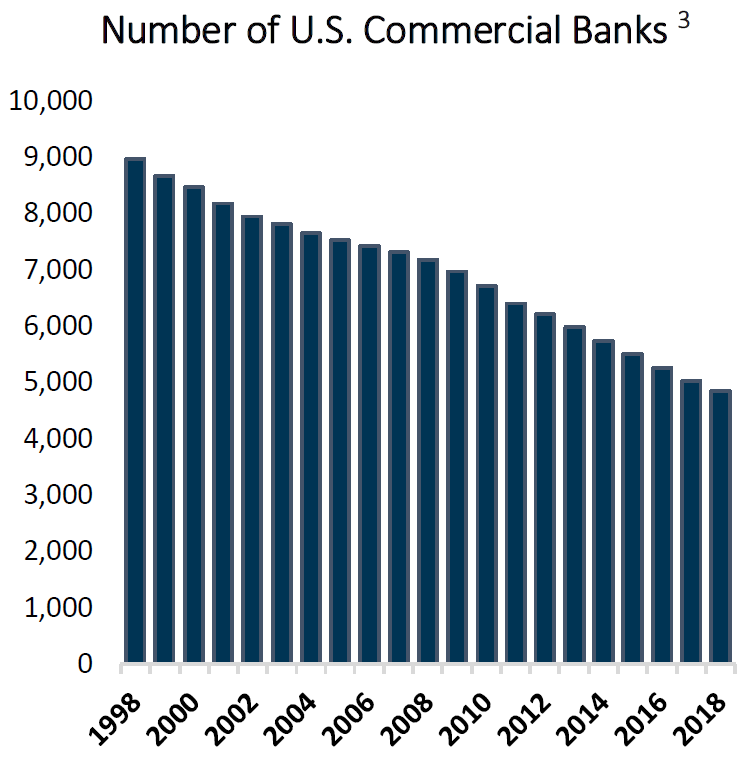
Adding to this imbalance, consolidation within the banking industry has continued to drive reductions in the number of U.S. banks able to offer lending solutions to companies. There are nearly 50% less banks in 2018 compared to the number in 1998.
Among the survivors, larger banks cannot scalably provide capital to smaller companies because of the specialized resources required to source, underwrite and manage small loan exposures, as well as regulatory constraints which restrict extending loans to companies that fall outside of a traditional commercial lending matrix. As a result, lenders have primarily focused on lending collateralized by real estate or accounts receivable – or transactions with larger borrowers, as well as companies owned by financial sponsors where they can leverage the work completed by the private equity buyers / owners.
Likewise, while the generally higher interest rates attached to lower middle-market loans would intuitively suggest higher associated risk, lower leverage within the asset class provides stronger capital protection characteristics than higher leveraged loans to larger companies.
Borrowers owned by large financial sponsors often take on more leverage through “covenant-lite” (cov-lite) loans, which have fewer financial and governance requirements for borrowers. As the supply of capital available to sponsors has multiplied over the past decade, cov-lite loans have captured the lion’s share of new institutional loans, totaling ~$370 bn in 2018. 5
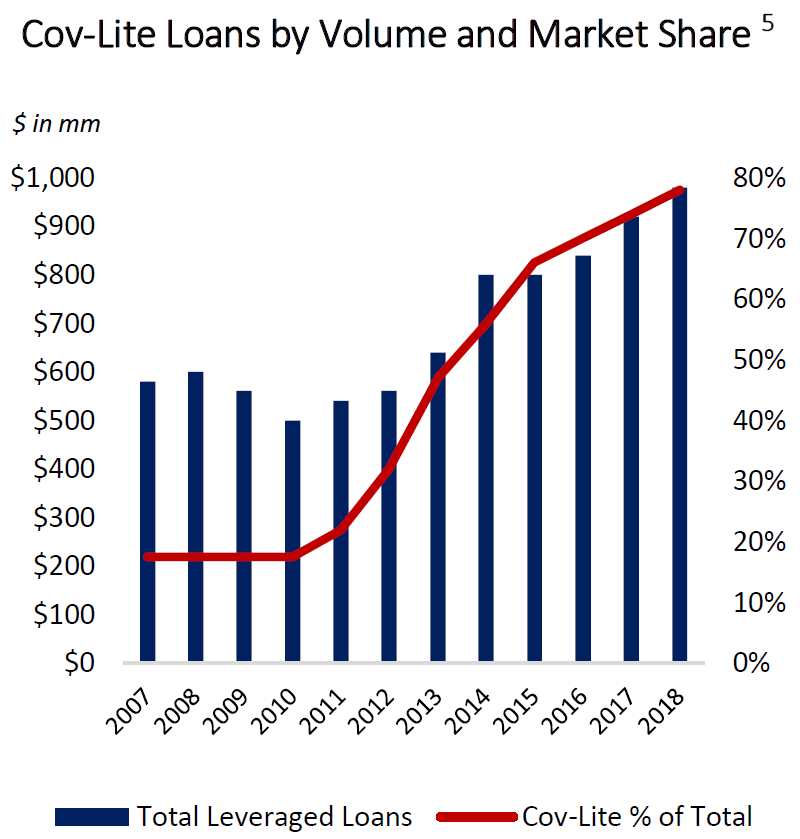
The growth of cov-lite issuances brings new risks to the table – as Moody’s warns that these securities contain “few of the lender protections once typical” for the asset class.6 With reduced capital protection elements, lenders now carry more exposure than they traditionally would.
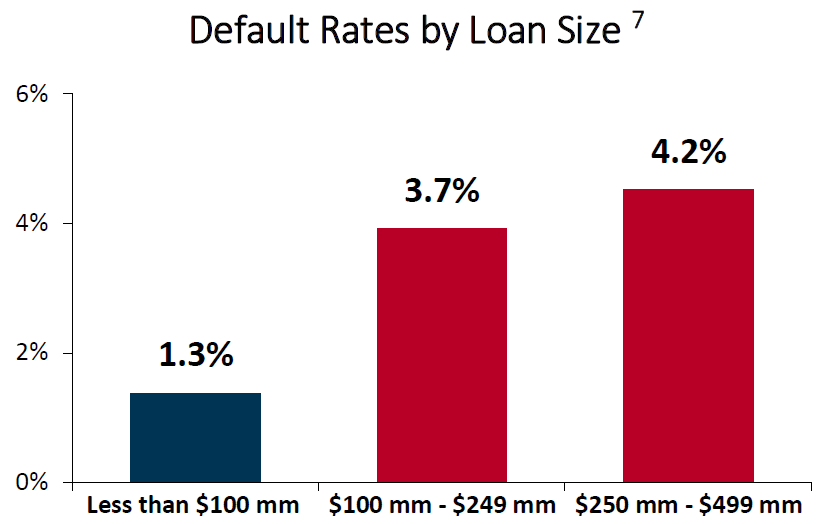
Taken together, higher leverage and weaker covenants can prime loans for higher instances of default. S&P Research supports this conclusion – as larger loans had a near 3x higher default rate than smaller loans.7
The limited supply of lower middle-market capital delivers an opportunity for superior risk-adjusted returns.
Hunting for alpha
Dating back to when I worked at Salmon Smith Barney (now Citigroup) in the early 2000’s, we analyzed insurance companies and asset managers to help them look for long-term, defensive, wealth creating strategies.
Exposure is a two-way street, and while Beta correlates risk, it also correlates return. While we would expect some portion of return to stem from market correlation, idiosyncratic, non-correlated returns, unrelated to or in excess of the market (“Alpha”) can provide investors with gains independent of the macroeconomic environment.
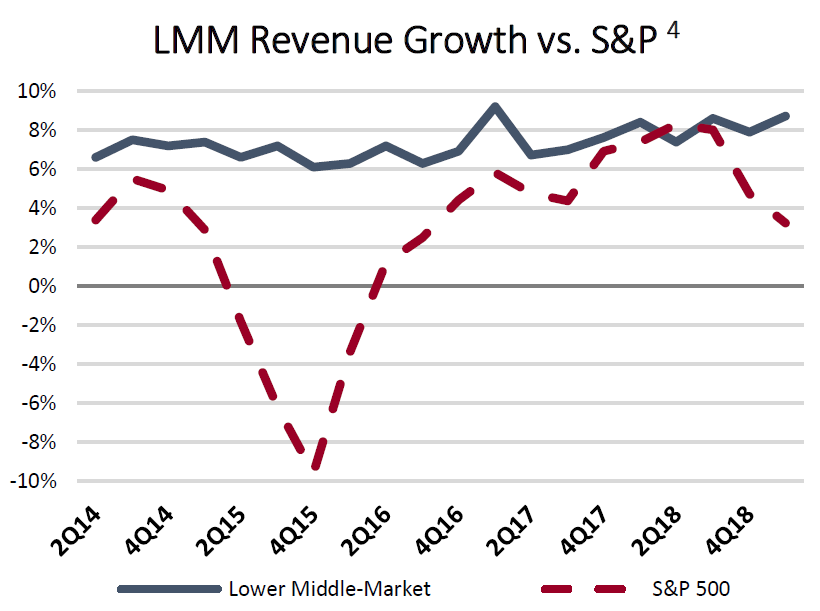
The U.S. lower middle-market is particularly difficult to establish comparables for, as many of the assets are too small to be reported by data providers like S&P who focus on larger, more liquid private loans. Despite these challenges, historical performance indicates that lower middle-market businesses are resilient, even in periods of macroeconomic stress and market headwinds.
U.S. LMM Outlook
The primary driver for the U.S. lower middle-market’s outsized returns and attractive structure lies in the market inefficiencies created by the limited supply of capital deployed into it. However, much of the lower middle-market’s value lies largely untapped due to the substantial barriers to entry and high labor inefficiencies inherent to lending in the smaller deal marketplace.
As a highly fragmented space with significant variance in the levels of business professionalization, lower middle-market deal flow and origination is highly proprietary. Unlike the middle market, there are significantly fewer professional buyers for assets, and many companies remain family owned. Identifying opportunities to engage thus requires a wide network of connected advisors, operators and partners with a deep history of investing in the asset class.
Likewise, underwriting in the lower middle-market is an intensive task, as smaller businesses with less rigorous financial reporting and less defined capital structures introduce additional ownership dialogue and key person risk, creating new complexities during the diligence and structuring processes. In many transactions, sellers are not advised by an investment bank or a financial sponsor and lack the institutional reporting and accounting capabilities that external groups help bring to the table.
Sifting through this often-disorganized data to responsibly address and diligence these factors is a labor-intensive process that requires significant time and analysis. Meeting these challenges requires an underwriting team tailored to the nuanced, opaque nature of the lower middle-market and willing to get its hands dirty as it dives deep into the diligence process. For these reasons, many large, institutional investors stay away from the lower middle-market, as the labor-intensive requirements of the sector prove inefficient for their capital deployment needs.
Despite these labor inefficiencies, specialized lower middle-market asset managers continue to try and meet the capital needs of America’s growth engine of the lower middle-market. For doing this, they are compensated more for the labor intensity (vs. risk as in more efficient markets) and enjoy historically uncorrelated returns.
Sources and citations
1. Bain Global Private Equity Report 2019.
2. National Center for the Middle Market. 2019 Q1 Report on the Middle Market.
3. Federal Reserve Economic Data, 1998 – 2016.
4. National Center for the Middle Market, 2H 2018 report.
5. S&P LCD Quarterly, 2018Q4.
6. Moody’s, "Funds & Asset Management: Largest PE firms will outperform smaller players in a downturn”.
7. S&P LCD Institutional Loan Default Review.
Disclosures
Any projections, commentary or other forward looking statements in this article are our opinions and are based on research, analysis, and assumptions made by the Star Mountain.
Certain information contained herein has been obtained from third party sources and such information has not been independently verified. No representation, warranty, or undertaking, expressed or implied, is given to the accuracy or completeness of such information.
This article is for discussion purposes only and is not an offer to sell or the solicitation of an offer to buy an interest in any investment.