Value Innovation: Improving the Buyer Utility Map

Introduction
The book Blue Ocean Strategy by Professors W. Chan Kim and Ren'e Mauborgne of the INSEAD Business School in France is possibly one of the most read books on innovation in recent years. In it, the authors describe how companies can use innovative products to open up new markets in which they can grow without fear of competition. The book contains several tools for generating ideas for such products.
One of these tools is the Buyer Utility Map. This is a table which contains search fields for potential new products. The rows of the table are Utility Levers, which are paths to providing increased customer value. In the book, these levers are:
- Risk
- (Customer) Productivity
- Convenience
- Environmental Friendliness
- Fun and Image
- Simplicity
The columns of the table are the phases of the so-called Buyer Experience Cycle. These are the phases in which in the customer comes into contact with the product: Purchase, Delivery, Use, Supplements, Maintenance, and Disposal.
The combination of six rows and columns gives a total of 36 cells. Each cell describes a different approach to inventing a new or improved product. The original Buyer Utility Map can be found in many places on the Internet, including Wikipedia.
Improvements
Any good model can be expected to possess two important properties:
- Completeness: No relevant aspects are missing from the model.
- Redundancy-free: The components of the model are disjunct; no component contains aspects of another.
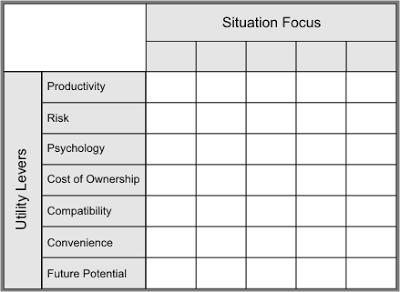
A model which does not have these properties is of limited use. We have therefore analysed the Buyer Utility Map in order to determine whether the columns and rows of the table contain all relevant possibilities and whether they are free of overlap. The result of our analysis is shown in the diagram at the beginning of the article.
The Rows
Of the six rows of the original model, we retain the first three (Productivity, Convenience and Risk) unmodified. Simplicity we think is redundant, since it either serves Convenience or Productivity. In other words, it is not an independent category of customer value. Fun and Image we believe is incomplete. These are two examples of psychological benefits, which - although they certainly provide customer value - are not the only possibilities for doing so. Further examples are the calming effect of cigarettes or chewing gum and the feeling of belonging provided by fan merchandise. For this reason, we have generalised this category and call it Psychological Benefits.
Environmental Friendliness we also believe should be generalised. We prefer to use the concept of Environmental Compatibility. Environmental Compatibility contains classical environmental friendliness in the sense of low energy consumption or reduced waste, but goes further. Environment we take to mean in the most general sense, including, for example, the functional or physical environment of a product. Compatibility is also more general, and includes technical and stylistic compatibility. We can therefore say that a computer has a high Environmental Compatibility, if it has many interfaces to other devices, and a piece of furniture has a high Environmental Compatibility, if it matches the decorating style of the room it is to be placed in. Future Potential is a new category, which has no corresponding element in Kim and Mauborgne. This lever addresses the attributes of a product which give it future potential in the widest sense. For a technical device, this might mean including a new interface which is not yet standard, but which promises to become one. A product also has a higher Future Potential if its resale value is increased or the guaranteed availability of spare parts is extended further into the future. Total Cost of Ownership is another new lever. This refers to all financial and other costs associated with the ownership and use of a product. Examples are the purchase price, operating and maintenance costs and space requirements. Any reduction in these costs means an increase in customer value.For each lever, we have developed a checklist which contains suggestions on how to achieve the corresponding customer value. For example, the checklist for Convenience contains (among others) the following suggestions:
- make it more comfortable
- make access easier
- make it easier to understand
- individualise it
- simplify operation
- make it more intuitive
The Columns
In Kim and Mauborgne's original model, the columns of the matrix contain the so-called Buyer Experience Cycle. This describes the individual phases in which the customer has contact with (i.e. experiences) the product. These are Purchase, Delivery, Use, Supplementals, Maintenance, and Disposal. However, the Buyer Experience Cycle only represents one of many possible perspectives on a product, which we believe could all be used in the same manner. For this reason, we believe that the Buyer Utility Map lacks generality. It is not clear (at least not to me), why Kim and Mauborgne chose this particular angle. One obvious limitation is that it does not apply to services (since services have neither delivery nor disposal.) For this reason, we have generalised the column definition from Buyer Experience Cycle to Situation Focus. With Situation Focus, attention is drawn a particular perspective on the given situation. Some of the possible perspectives are:
- Buyer Experience Cycle (as in Kim and Mauborgne)
- Components of the product (for example Interior, Engine, Trunk)
- Processes in connection with the product (for example standing in a queue, pushing a shopping cart, looking for a parking space)
- Functions of the product, (for example opening an account, investing money, checking the balance)
- Tasks in connection with the product (for example parking, filling up, loading luggage)
- Target Groups of the product (for example teenagers, professionals, single parents)
Of course, depending on the given innovation task, each of these focuses may be more or less appropriate.
Application
There are five steps involved in applying the model:
- A relevant Situation Focus is chosen, for example Tasks.
- The corresponding components are entered into the column titles, for example filling the tank, changing a tyre, parking, loading luggage.
- A Utility Lever is chosen, for example Convenience.
- Using the appropriate checklist for the Utility Lever, formulate questions that inspire new product ideas, for example How can we make operation more intuitive? How can we simplify changing tyres?
- Repeat from number 3 using a new lever.
The entire procedure can, of course, be repeated using a different Situation Focus. The result are new ideas which provide different types of customer value and are generated from many different perspectives on
the given situation.
Acknowledgements
The work presented here is part of the Idea Engineering research at the University of Magdeburg, Germany. The improvements were developed in conversations with Jana G'rs and Ren' Chelvier (Zephram Corporation), Stefan Knoll and Falko Werner (doctoral students) and David Bobles and Jana Schumann (undergraduate students).