Where are we in the credit cycle?

In this article, Edward Altman, Max L. Heine Professor of Finance, Emeritus at NYU Stern School of Business, will comment on the nature of credit cycles, both benign and stressed, where we are in the current cycle and why Altman believes that the next stressed cycle will be longer and deeper than most have been in the past, but probably not as dramatic and global as the last crisis in 2008-2009.
What is a benign credit cycle?
In my opinion, benign credit cycles are periods when all or most of four aspects of the market are providing incentives to major growth in the supply and demand for credit. These are:
1. low and below average default rates,
2. high and above average recovery rates on whatever defaults do occur,
3. low and below average yields and spreads that investors are requiring from issuers, and
4. highly liquid markets, whereby even the most risky credits are able to issue debt at reasonably low interest rates, in considerable amounts.
Now, at the midpoint of 2019, all four indicators are saying that we are still in a benign credit cycle, one that if we consider 2016 as an energy industry anomaly, has just concluded its 10th year, the longest by far of any benign cycle in modern finance. Nonetheless, I am concerned that the bubble in credit markets has achieved new momentum, as my discussion below indicates.
We can observe in Figure 1 that the benign credit cycles of the recent past of well below average default rates, high recovery rates, low interest rate spreads, and high liquidity, have lasted between four and seven years. The current cycle of 2009-2019 has now lasted ten years! Going back to the beginning of the modern high-yield bond market in the late 1970’s, the average benign cycle has averaged about six years. Also note that once a benign cycle ends, the subsequent spike in high-yield bond default rates and fall in recovery rates have been dramatic, with default rates reaching at least 10% for one or two years, and recovery rates dropping below 40%, and sometimes below 30%.
The weighted-average dollar-denominated high-yield bond default rate from 1971-2018 is 3.27%, with a standard deviation of 3.1%. For the first half of 2019, the rate is 1.1%. Recovery rates measured as the weighted-average prices of defaulted bonds just after default was 52.1% in 2018 and 48.8% for the first six months of 2019. These are considerably higher than the historic average of 39.0% on high-yield corporate bonds.
The three recent spikes in default rates to levels of 10% or more were accompanied by economic recessions. Forecasting the timing of economic recessions is challenging, at best, and to estimate the confluence of a stressed credit cycle with recession is a “perfect storm” that has occurred a number of times in the recent past and is likely to occur again – the timing is the difficult issue. However, it is clear that if, and when, we do have another economic downturn, default rates will increase to significantly high levels and defaults to very high dollar amounts. While the catalyst to a credit market crisis is very difficult to identify, it could be as simple as a major correction in the stock market or a significant decrease in economic growth in a systemically important country (e.g. U.S. or China) or region (e.g. Asia). Indeed, the spike in yield-spreads and negative and volatile returns early in 2016, and again in the final quarter of 2018, seem to have been associated with concerns about China and the U.S. and lower oil prices, not to mention the now clear high correlation with the stock market. Indeed, this correlation has spiked to above 70% since the financial crisis of 2008-2009.

Yield spreads and risk tolerance
Figure 2 shows the non-investment grade yield spreads since the record low point in June 2007, when the YTM spread was only 2.6%. As of June 30, 2019, the yield-spread was 4.54% (option-adjusted spread of 4.07%), 193bp above the all-time low point, and 66 bps below the historic average spread of 5.20% for high-yield bonds in the U.S. Investors seem content with these yields, and fund flows into risky debt markets have been choppy, but still reasonably high as of late. In other words, “risk-on” is still the current theme in credit markets.

Our fourth credit cycle measure involves the liquidity of the market. This is, by far, the most elusive, volatile and difficult metric to measure and forecast. I have selected as an important measure of market liquidity the amount of CCC rated bonds issued as a percentage of all high-yield bonds. In other words, this is a measure of the market’s acceptance of the lowest quality bonds, especially at relatively low interest rates. Indeed, the historic cumulative five-year default rate for CCC bonds is about 47%! Interestingly, this CCC proportion registered an all-time high of over 37% in 2007, one year before the start of the last crisis, and has averaged 17.3% since 2005 (14 years). In 2018, it was 17.3%, and so far in 2019 it is 10.2%, indicating an average, but a somewhat reduced measure of market liquidity. We will monitor this metric closely in the next quarters.
U.S. corporate debt growth
I am very concerned about the enormous growth in U.S. corporate debt, and, in general, global debt issuance in the last ten years. Since 2009, corporate bonds, both investment and non-investment grade, in the U.S. have about doubled to more than $9 trillion in 2019. The largest growth in dollar amount has been in the BBB rating class, to about $2.5 trillion, while high-yield bonds have grown by more than 60% to $1.67 trillion. Coupled with a similar growth in leveraged loans, most without any meaningful protective covenants for investors, we can see why the enormous liquidity has fostered a “risk-on”, low default market as investors seek higher yielding, more risky debt in a generally low interest rate environment. In addition, the non-bank lending to commercial borrowers (the so-called shadow-banking market) has exploded to an estimated 42% of all commercial lending (Bank of America, Merrill Lynch estimate in 2018).
Figure 3 shows the Non-Financial Corporate Debt (NFCD) as a percentage of GDP compared to our dollar-denominated high-yield bond default rate for the period 1987-2018. Note that the three peaks in NFCD/GDP prior to the possible new peak in 2018, were followed by huge spikes in the default rate on risky debt. Of course, interestingly, these peaks in default rates followed closely the end of the prior recession period. According to a large percentage of economists, there appears to now be a reasonably high probability of a recession in the next 12-24 months in the U.S. Thus, the recent noticeable increase in NFCD/GDP to perhaps a new peak causes me to be extremely concerned about the magnitude of the next spike in default rates, whenever it occurs.

Global debt growth
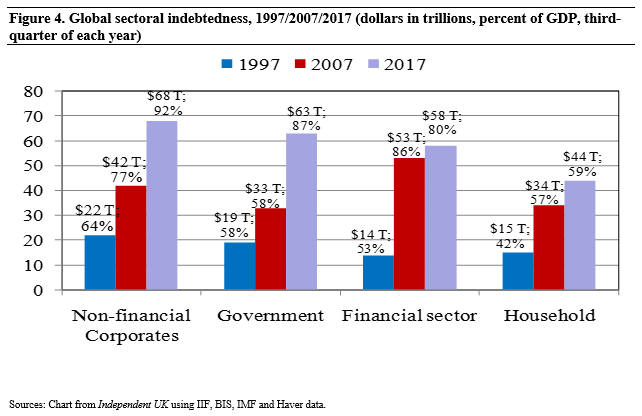
Figure 4 shows the four main sectors of global debt and their growth over the past 20 years. Note the enormous increase in NFCD/GDP from 64% to 92% and from 58% to 87% for Government Debt/GDP. Less worrisome is the growth in Financial Corporate and Household Debt, although the latter area is still of great concern in certain regions, like Scandinavia. If one combines the four sectors’ Debt/GDP ratio in 1997, 2007 and 2017, the result is a Total Debt/GDP of 217% in 1997, 278% in 2007 and 318% in 2017! In our opinion, one can attribute the growth in global GDP, in large part, to the use of relatively low-cost debt to fuel GDP growth, albeit the latter was not at an impressive rate.
Corporate credit risk profile 2007 vs. 2017: Comparing Z-scores
The discussion of required yield-spreads and risk tolerance begs the question as to whether the credit default profile of corporate bond issuers, in general, and high-yield issuers in particular, are stronger of late compared to what they were in 2007, just before the default rate started to rise significantly during the financial crisis. Were investors requiring an absurdly low rate of return in 2007, given issuer risk profiles, and are they doing the same thing in 2019? To answer this question, we present our Z-score comparisons extended to the end of 2018 and compared to 2007. For a detailed description of the Z and Z”-score models, see E. Altman, E. Hotchkiss and W. Wang, Corporate Financial Distress, Restructuring and Bankruptcy, 4th Edition, John Wiley & Sons, Jersey City, NJ.
In 2007, the median Z-score on a sample of 294 high-yield bond issuers was 1.84, mapping to a bond-rating-equivalent (BRE) of B+. The median Z”-score was 4.82 (B+, also) on a sample of 378 issuers. In 2018, the median Z-score on a larger sample of 529 high-yield issuers increased slightly to 1.98 (still a B+ BRE). The median Z”-score was 5.09, rising to a BB- BRE in a sample of 583 firms. Thus, both the Z and Z”-scores of the more recent period were marginally, but not statistically significantly, higher than they were in 2007. The higher earnings and cash flow figures were essentially neutralised by much higher levels of debt in the most recent period, even if we factor in the substantial increase in the sample’s market value of equity (X4 in our model). To be slightly better than the credit profiles just before the last crisis is not a measure of credit confidence. The continued low level of credit fundamentals does not seem to be influencing current required yields and spreads, however. I think it should!
Conclusion
All indications point to the benign credit cycle continuing through 2019, and possibly longer, especially with the near-term outlook for positive economic growth in the U.S. and China, albeit at lower levels. History has shown that even if GDP growth is positive, default rates on U.S. corporate debt can, and in many cases will, start rising before a recession begins. The current cycle has also been extended by numerous out-of-court restructurings, the covenant-lite environment, and expectations that the FED will aggressively move to provide monetary stimuli if there are signs of an economic slowdown and increased financial market volatility. When market forces, both macro and micro, point to an unmistakably negative outlook, I expect that the next stressed credit cycle will be deeper, e.g. higher default amounts due to the enormous amount of bond, bank and non-bank debt build-up, and perhaps longer than the last crisis period as whatever central bank actions prove inadequate and/or fiscal stimulus, if any, takes longer to assist in the eventual recovery. I am not convinced that the crisis will be as severe globally, however, unless real estate markets and personal mortgage losses also escalate dramatically, and China’s economy contracts significantly.
