Will the technology sector always be a winner?

Technology has always been a popular sector for investments - but does it really live up to its reputation? CEPRES' Christopher Godfrey and Jinfang Shi gives us a deep dive into the stats and analyse the performance of deals and exits within the sector to reveal the true picture.
Private market deals have delivered substantial returns over the last decade, achieving 29% pooled gross internal rate of return (IRR) based on a transaction level analysis of 69,904 private investments from CEPRES PE.Analyzer. Among the more promising investments, Technology has become very attractive to investors across multiple investment stages, with impressive top-line growth driving strong returns.
Tech is a resilient sector, having shown higher returns than other sectors just before the Global Financial Crisis (GFC)[1]. In the current cycle (2009 – 2015), tech deals achieved a money multiple of 2.1, i.e. tech deals returned over two dollars ($2.10) for every dollar of invested capital on a gross pooled basis, coming in just behind the Healthcare sector (returning $2.20 for every $1)[2] and ahead of Financial services, Consumer and Industrials, among others.
Will this sector continue to deliver alpha under increasing competition? To find an answer to this question, we evaluated the main drivers of returns of 4,775 PE-backed technology firms invested across 1,153 funds from 2003 - 2016, to determine the sustainability of returns in Tech buyouts.
Comparing the average Compound Annual Growth Rate (CAGR) of Revenue in PE across different industries, we can observe a clear outperformance of the technology deals against other industries (see figure 1 below), which aligns with the common belief that tech firms perform well in the top-line growth. Taking Industrials as a comparison, PE-backed technology firms outperformed industrials in general, and the outperformance has been getting stronger since 2007 - the spread widened from 8% in 2007 to 22% in 2016:
Figure 1: Mean Revenue CAGR by Investment Year
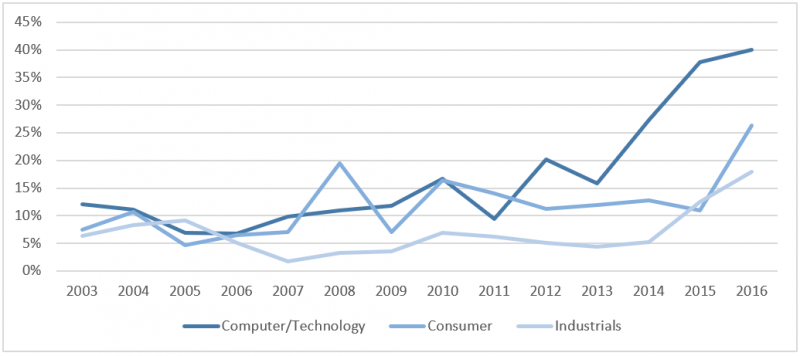
Source: CEPRES PE.Analyzer
With a proven steady and significant increase in top line Revenue CAGR, we want to also evaluate if PE-backed technology deals are able to transform Revenue growth into bottom line EBITDA gains. Figure 2 shows the measurement of EBITDA CAGR for PE-backed companies across 3 sectors, Technology, Industrials and Consumer in the past years.
From this we can derive that in the most recent years, PE-backed Technology firms have generally outperformed both Industrials and Consumer when measured from an EBITDA growth perspective. The growth of the tech firms invested in 2015 was especially strong, achieving an impressive 46% EBITDA CAGR versus the 9% in the Consumer and 13% in the Industrial industries.
Figure 2: Mean EBITDA CAGR by Investment Year
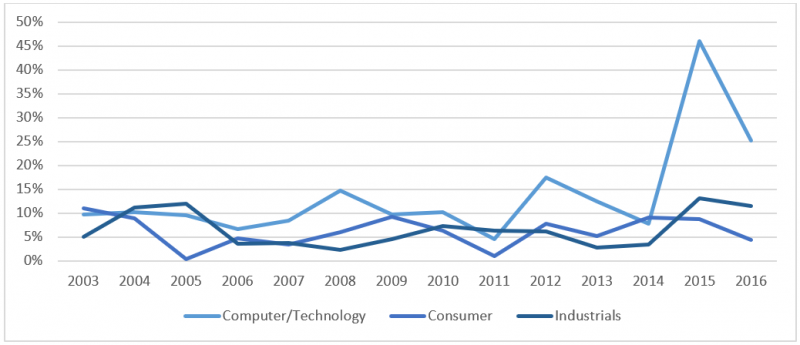
Source: CEPRES PE.Analyzer
The value of “high growth” Tech companies has been priced into the investment thesis with pricing multiples for strong Tech companies amongst the highest now for Buyouts.
Looking at the difference between Entry and Exit pricing multiples (Enterprise Value/EBITDA), we can evaluate the cost-efficiency of the investments and then capture the alpha generated in the process.
Figure 3 below shows the pooled entry and exit multiples by investment year of deals. This therefore represents the pricing spread achieved in case you had been able to invest in all PE Tech deals monitored on the CEPRES platform. We can see that in 2011 the entry price multiple of Tech deals was 8.7x and the exit price multiple was 20.3x. Thus 2011 achieved an extraordinary high pricing spread of 11.6 between entry and exit pricing of deals executed in that year.
Figure 3: Technology Industry Pooled Pricing at Entry and Exit/Current by Investment Year
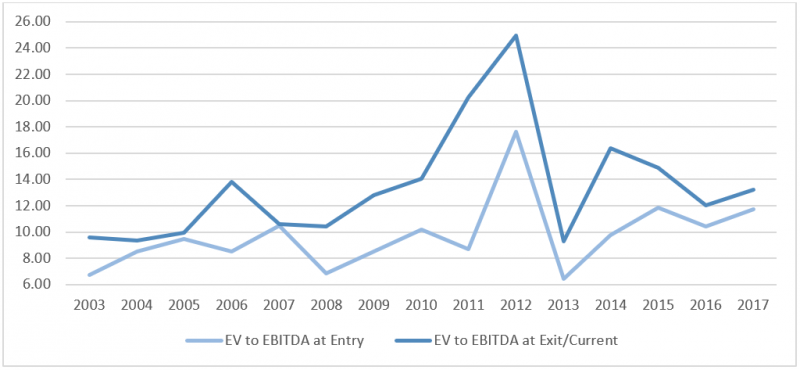
Source: CEPRES PE.Analyzer
Looking at the trends in the multiple expansion over time, we observe a relatively correlated trend between entry and exit pricing. Since the GFC, both entry and exit multiples have overall trended higher with a dip in 2013 deals and spread compression after 2013.
However, the spread compression in recent years is not a reflection of weaker growth, which as we see is increasing. Rather it may be as a result of transition of Tech companies from a growth phase to a more mature profitability. As such, traditional Multiple Expansion based on EBITDA is replaced by revenue expansion as a driver of company value and thus investment returns. A well-known example of this phenomena is Amazon, where even after their IPO there was an extended period of low EBITDA and massive valuation multiples based on market growth potential. As the company matured and the bottom line came more into focus, the EBIDTA multiples reduced. Today, Amazon has a very impressive Price-to-Earnings (P/E) ratio of 77, but this is 95% lower than it was 5 years ago, at 1,445.
Figure 4: Technology Deals Value Creation Post GFC (2010-2018)
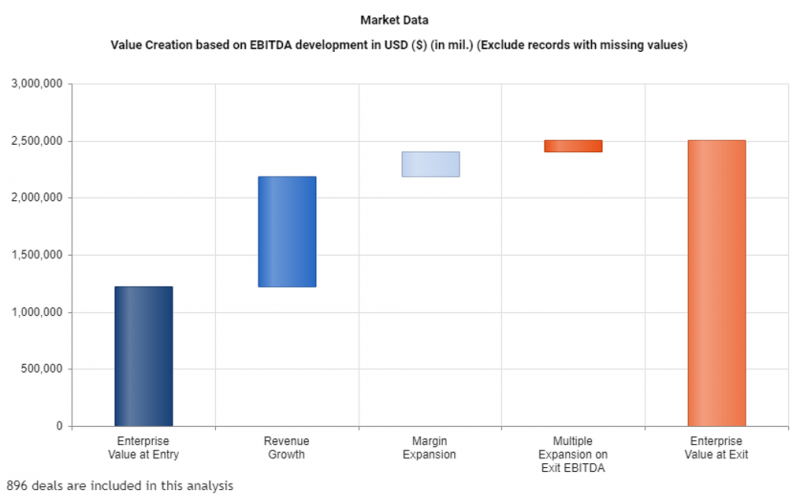
Source: CEPRES PE.Analyzer
By decomposing the drivers of returns, it shows that the majority of returns for technology investments are driven by top-line growth, and then evolve to net returns via EBITDA CAGR and multiple expansions. Meanwhile, recent spikes of EBITDA CAGR may be a sign of a new focus on tech investments – driving higher margins while still aggressively expanding revenue.
While this analysis depicts a positive momentum for the tech sector, we would advise thorough due diligence on the part of investors and to consider a properly balanced portfolio. As with any investment, and especially in the alternative assets, investors need to undertake a thorough technical and fundamental analysis before committing their capital. A flexible due diligence platform will allow to perform these analyses in an easy, efficient and scalable way, to ensure that decisions are made with confidence.
[1] https://www.bain.com/insights/which-sectors-hold-up-best-in-a-recession-snap-chart/?_lrsc=9b9242b1-6913-4435-a166-251916e6ed7c&utm_source=Elevate_LinkedIn&utm_medium=social&utm_campaign=LinkedIn
[2] Page 25, Figure 1.22 https://www.bain.com/contentassets/875a49e26e9c4775942ec5b86084df0a/bain_report_private_equity_report_2019.pdf