
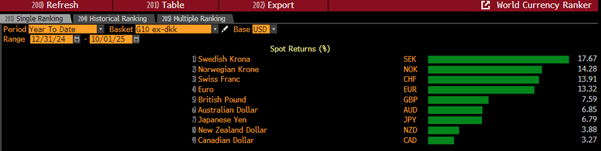
Going into Q4, we can see that the USD has been a material loser across the board so far in 2025, from -2.3% CAD through to -13.9% CHF, -14.3% NOK and -17.7% SEK. The Scandi year so far!
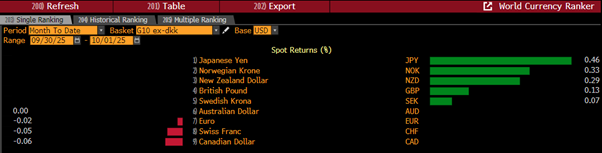
At the start of the final quarter and in the early exchanges of October, the USD is largely a loser, most acutely vs -0.3% NZD and NOK and -0.5% YEN amid US government shutdown problems, a softening US labour market and questions over the independence of the Fed.
As usual, from a seasonality perspective, the question is how does the Dollar tend to perform during the first month of Q4 and are there any G10s that seem to perform particularly well/badly through October?
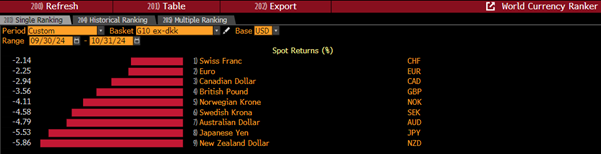
In 2024, see image above, the USD was a material winner across the board, from +2.1% CHF through to +4.8% AUD, +5.5% YEN and +5.9% NZD. The USD was supported by Trump re-election hopes and his promises on tariffs as well as hopes on fiscal expansion and positive rate and growth differentials.
In 2023, see above, the USD only really lost out vs -0.5% CHF. Elsewhere, the USD enjoyed strong gains, especially against +2.4% SEK, +2.9% NZD and +4.3% NOK.
In 2022, the USD was largely a loser, most notably against -2.7% GBP, -3.8% NZD and -4.7% NOK. Sold USD wins came vs those havens +1.4% CHF and +2.7% YEN.
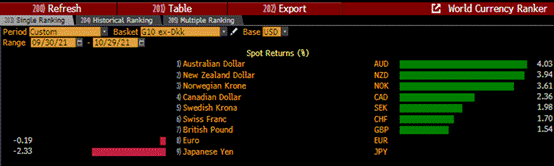
In 2021, see above, a similar situation. Sizeable USD losses, from -1.5% GBP through to -3.6% NOK, -3.9% NZD and -4.0% AUD. Only USD wins +0.2% EUR and +2.3% YEN.
In 2020, the USD was a mixed performer. Most acute losses came against the -0.7% SEK and -0.8% YEN. Biggest USD wins were +1.9% AUD and +2.1% NOK.
In 2019, the was USD also a near total loser. From -0.1% JPY through to -2.3% EUR, -2.4% NZD and -5.3% GBP. Only USD win came against +1.0% NOK.
In 2018, the near opposite. Only USD loss came against the -0.7% JPY. Material USD wins came from +1.5% NZD through to +2.5% EUR, +2.7% CHF, +3.0% SEK and +3.4% NOK.
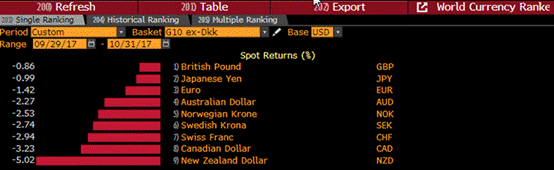
In 2017, see above, the USD won out across the G10 board. From +0.9% GBP through to sizeable gains vs +2.9% CHF, +3.2% CAD and +5.0% NZD.
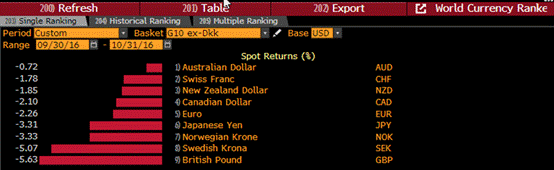
To Oct 2016, see above, and again the USD took on all comers, winning out everywhere. From +0.7% AUD through to +3.3% YEN and NOK, +5.1% SEK and +5.6% GBP.
Ten years ago, (for the first time) mixed. Sizeable USD losses came against -1.7% AUD, -1.8% CAD, -2.0% GBP and -5.9% NZD. Commodity bloc strength. USD wins included +1.5% EUR and +2.0% SEK.
In 2014, sole USD loss came against the -0.6% AUD. Everywhere else in G10 land, USD gains. Biggest upside came vs +2.4% YN, +2.4% SEK and +4.8% NOK.
In 2013, back to mixed amid little direction. Most notable USD losses came against -1.2% NOK and -1.5% AUD. Largest USD gains against +0.8% SEK, +0.9% GBP and +1.2% CAD.
In 2012, again mixed and only limited direction. Biggest USD losses came against -0.8% EUR and -0.9% CHF, with biggest wins vs +1.1% SEK, +1.6% CAD and +2.3% YEN.
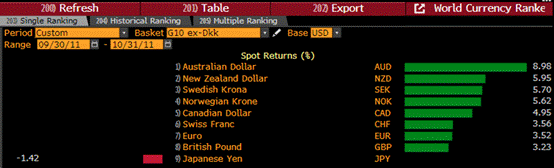
In 2011, see above, the USD was a big loser. From -3.2% GBP through to -6.0% NZD and -9.0% AUD. Sole USD win came against the +1.4% YEN.
In 2010, the USD was an across the board loser. From the barest of margins -0.01% CHF through to -2.3% EUR, -3.9% YEN and -4.4% NZD.
In 2009, a more mixed picture. USD losses came against the likes of -1.0% CHF, -1.9% AUD and -3.0% GBP. USD wins included +1.4% CAD and +1.9% SEK.
In 2008, and in the midst of the GFC and in the wake of the Lehman collapse the USD dropped -7.8% JPY. Against everything else, the USD soared, from +3.1% CHF through to +12.2% CAD, +12.9% NOK, +13.0% NZD and +15.7% AUD.
In 2007, a near full slate of USD losses. Most acute -2.0% NZD and -5.2% AUD and CAD. Sole USD win +0.6% YEN.
A similar picture in 2006. The USD was mostly a loser, sharpest losses coming against -1.9% GBP, -2.7% NZD and -3.7% AUD. Only mini USD gains versus +0.1% NOK and +0.4% CAD.
In 2005, more mixed. Biggest USD losses -0.7% NOK and -1.3% NZD. Largest USD gains +1.8% AUD, +2.5% YEN and +2.7% SEK.
In 2004, across the board USD losses, from -0.9% NZD. Largest USD downside came against -3.6% CAD, -4.0% YEN,-4.3% CHF and -5.4% NOK.
2003 was mixed. Material losses vs -1.4% YEN, -2.0% GBP, -3.1% NZD and -4.2% AUD. Largest USD gains came vs +1.0% SEK and +1.5% CHF.
In Oct 2002, G10 FX was fairly steady overall. Material USD losses came against -1.2% SEK, -1.8% CAD, -2.2% AUD and -3.6% NZD. Largest USD win was just +0.6% YEN.
In 2001, largest USD losses came against the -1.1% NZD and -2.4% AUD. The USD mainly a small winner through the month, with largest gains coming against +1.4% GBP and +2.3% YEN.
For good measure, in 2000, the USD won out across the G10 board. From +0.6% YEN through to +3.8% EUR, +4.0% CHF and +4.5% AUD.
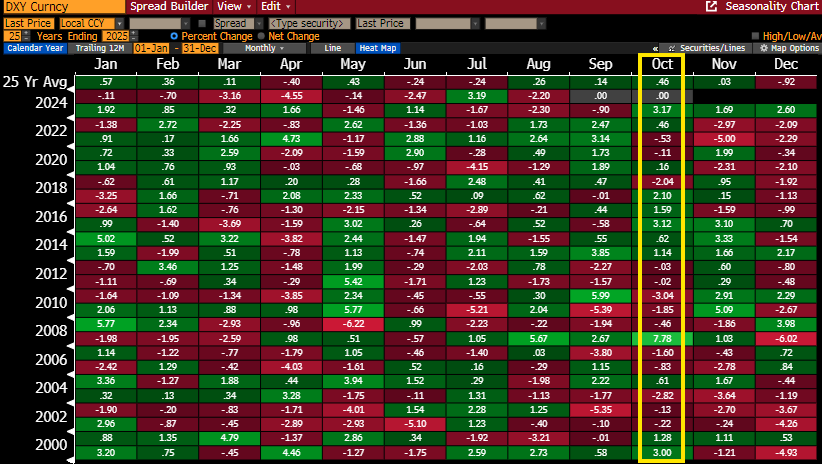
See above, the DXY USD INDEX has gained on ave +0.5% per month in Octobers since 2000. It is also up in 11 of the previous 14 years so there is a decent trend there.
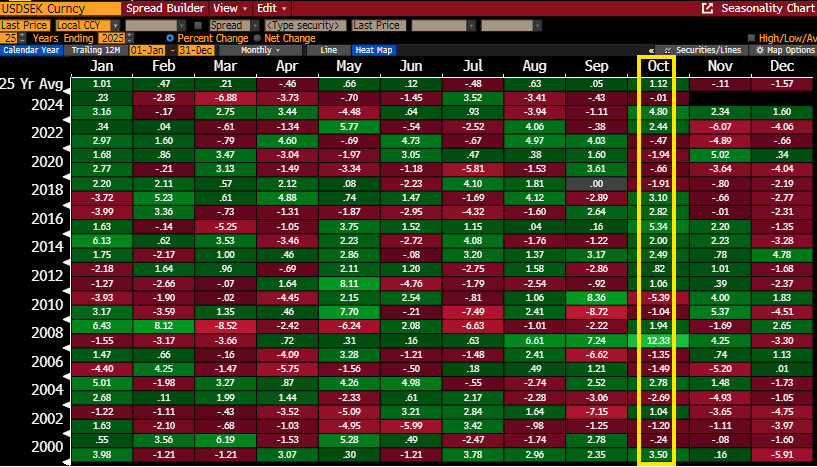
See image above. Overall, the USD tends to perform best vs the SCANDIS. The USD is up on ave +0.9% vs NOK and +1.1% SEK during the period. EUR/SEK has been down in nine of the last 13 Octobers.
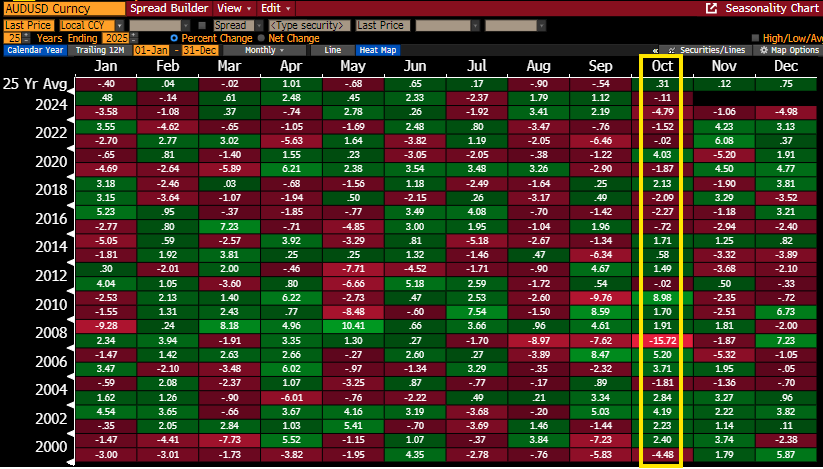
Elsewhere, however, the ANTIPODEANS are mini relative outperformers. See above, both AUD and NZD are up around +0.3% and +0.2% p/m over the same period though in most recent years there have been straight losses.
Something new for 2025, see table below - The USD's performance on average vs each G10 since 2000 in Octobers.
| AUD/USD | USD/CAD | USD/CHF | EUR/USD | GBP/USD | USD/NOK | NZD/USD | USD/SEK | USD/YEN |
| +0.3% | +0.4% | +0.4% | -0.4% | Flat | +0.9% | +0.2% | +1.1% | +0.5% |
Trade idea
It looks like EUR/SEK though it comes with a warning that some of its best years came about 10-15 years ago.
However, since 2000, AUD/SEK has gained on average 1.3% per month in Octobers.
We will look to buy at current 6.2230 for 6.3750 initially, up towards the 200-dma at 6.3806.
We will leave our stop below the September 2 low of 6.1224 (at 6.1196).
AUD/SEK tech view
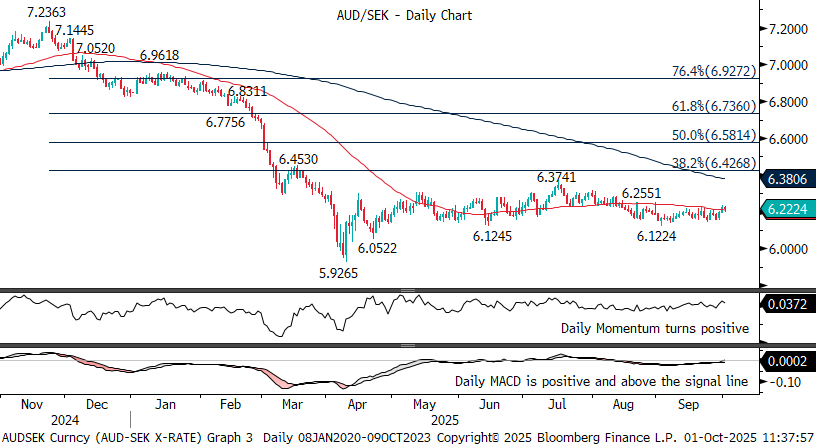
- AUD/SEK recovered from 5.9265 (2025 low - 9 April) to 6.3741 (16 July high), before easing to range over 6.1224 (2 September low)
- Studies are improving and while 6.1224 limits and further near-term dips, potential is seen above 6.2551 (21 August high) re-opening 6.3741
- A clearance is needed to confirm broader basing and open 6.4268 (38.2% retrace of 7.2363/5.9265 fall) then 6.4530 (18 March lower high)
- Only a return below 6.1224 averts and threatens a deeper near-term setback to 6.0522 (22 April higher low)
| SUPPORT AND RESISTANCE TABLE | ||
| R5 | 6.4530 | STRG (18 Mar 25 lower high) |
| R4 | 6.4268 | FAIR (38.2% retrace of 7.2363/5.9265) |
| R3 | 6.3741 | STRG (16 Jul 25 high) |
| R2 | 6.3204 | FAIR (31 Jul 25 high) |
| R1 | 6.2551 | FAIR (21 Aug 25 high) |
| 6.2224 | Price at update | |
| S1 | 6.1224 | STRG (2 Sep 25 low, nr 13 Jun 25 low - 6.1245) |
| S2 | 6.0522 | FAIR (22 Apr 25 minor higher low) |
| S3 | 5.9265 | STRG (2025 low - 9 Apr) |
| S4 | 5.8981 | FAIR (20 Mar 20 low) |
| S5 | 5.6750 | STRG (2020 spike low - 19 Mar) |