
The sentiment in junk bonds this week continues to be calculated and "in the moment" as the primary market trudges along like a tractor in low gear. Equity markets continue to be volatile. As was last Monday, one strong new issue, Molina Healthcare (MOH), announced and priced a strong BB credit with a favorable structure (5.25nc2) underwritten by Truist. There was modest daily activity throughout the week supplemented by large deals by large deals from Genmab (GMABDC) and Sabre (SABHLD), pausing on Friday. Issuance volume for the week was $6.40bn in seven deals including one 2-part.
Junk bonds continue to take direction from the health of the equity markets with the except for Thursday when HY closed higher in the Index when stocks sold off hard. The ICE / BofA US HY Index closed higher only on the last two trading day days this week. The Index had no big moves this week, only drifting back and forth on either side of positive. The weekly return was (+ 0.015%) with wider spreads (+ 12bps). Spreads mainly widened out this week and were only narrower on Wednesday (- 03bps). Spreads were wider for the week and are wider month-to date by twenty-five (+ 25) basis points in the Average spread. Weaker credits are underperforming better quality, and CCC's are wider by eighteen (+ 18) basis point this week. Month-to-date, BBs are lower by - 0.112%, while CCCs are lower by - 1.222%..
Stocks rebound from early selloff after NY Fed President Williams unexpectedly voiced support for a December rate cut. Market odds for Dec cut instantly pop to 70% from 25% Thurs. Sentiment remains fragile as crypto extends selloff, dollar advances as market participants see red flags on global liquidity, macroeconomic activity
Yields moved mostly lower today and the curve bull steepened as December odds improve. Stocks welcomed the message and rebounded. December rate cut odds continue to waiver as data and Fed speak pull at both directions.
University of Michigan Final Sentiment, conditions, and expectations printed 51 and matched its record low in current conditions. 1-year inflation expectations dipped to 4.5% from 4.7%. PMI's were mixed. US Manufacturing dipped to 51.9 from 52.5 previously, services were a touch higher to 55.0, while the composite saw a modest beat of 54.8.
With the resumption of BLS data, rates have pushed lower. Narratives have extracted whatever varying economic clarity they see imbedded in the economic data releases. Treasuries closed lower today by two to three basis points, and down by ten to twelve for the week. Stronger than forecast non-farm payrolls data was clouded over by the unemployment rate (4.4% highest since October 2021), the data point that draws attention on Main Street. Other BLS supplied data has created mixed messages (some stronger, some weaker) to both sides of the rate cut argument. The bottom line for the bond market is that labor conditions have likely weakened, and the odds of a December rate cut jumped to 70% from 25% late Wednesday.
Inflation risks and concerns about sending the wrong message have steered several FOMC members to favor a steady stance into year-end. Several noted the risk of disorderly stock moves if AI-related sentiment shifts. After Nvidia earnings and forward guidance temporarily propelled equity indices higher by roughly one percent across major indices following their Q3 revenue beat by $2 billion, and Q4 is forecast at $3 billion over consensus. The market changed course shortly afterwards and sold off by over two percent. Dissenters see inflation as a too big of a risk to ignore.
Also adding relief to the economic outlook, Walmart, the world’s largest retailer, beat on earnings and raised guidance. The did note softness in lower-income spending, bringing forward the K shaped economy narrative. The disparity in the health of the consumer is another concern for the FOMC, as well as the White House. So The Fed's "what to do" is complicated and runs deep.
NEW ISSUES THIS WEEK (11/10 - 11/14) :
This week, (Nov 17 - Nov 21), there were seven (07) USD high yield deals in eight (08) tranches priced. Volume for the week was $6.405bn. 2025 year-to-date volume is $295.90bn vs $260.19bn in 2024. 2025 volume is now ahead of last year (2024) by 13.72%.
Avg | +$0.426 | |||
Issue | Price | Bid | Ask | Δ |
AMPBEV 6 1/4 01/30/31 | 100.000 | 100.125 | 100.250 | +$0.125 |
CIFR 7 1/8 11/15/30 | 100.000 | 100.250 | 100.500 | +$0.250 |
SABHLD 11 1/8 06/15/29 | 100.000 | 100.625 | 101.125 | +$0.625 |
LB 6 1/4 12/01/30 | 100.000 | 100.375 | 100.500 | +$0.375 |
CROSIN 6 3/4 12/01/32 | 100.000 | 100.000 | 100.250 | +$0.000 |
GMABDC 6 1/4 12/15/32 | 100.000 | 100.875 | 101.375 | +$0.875 |
GMABDC 7 1/4 12/15/33 | 100.000 | 102.000 | 102.500 | +$2.000 |
MOH 6 1/2 02/15/31 | 100.000 | 100.375 | 100.875 | +$0.375 |
TODAY'S MARKETS:
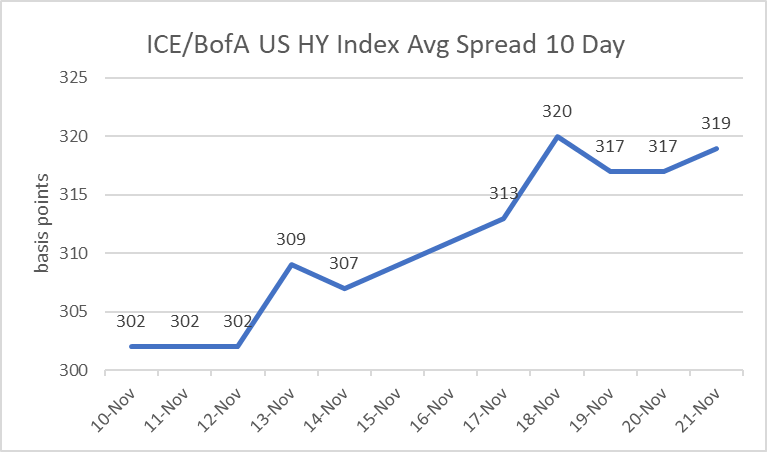
- High-Yield ICE/BofA index higher today (+ 0.043%). The average spread was mixed on (11/21) wider by two (+ 02) basis points at 319. The BB sector spread was wider by two (+ 02) at 197. The B sector was wider by three (+ 03) at 337. The CCC sector was unchanged (+ 00) at 920.
- Over the prior past five trading days, the Average is wider by + 12bps, BB's wider by + 12bps, B's are wider by + 12bps, and CCCs wider by + 18bps.
- The largest HY ETFs are HIGHER today (11/21) by + 0.32% on average and are HIGHER by + 0.17% over the past five trading days, on average.
- The CDX HY Index is HIGHER today, Nov. 21, by + 0.315 at 106.614. The best performers are NFE Financing LLC (NFE), Liberty Interactive LLC (LINTA), and CSC Holdings LLC (CSCHLD). The worst performers are Bath & Body Works Inc. (BBWI), DISH DBS Corp. (DISH), and The Hertz Corp. (HTZ)
- Oil (WTIJan26) is LOWER today by -$ 0.94 at $58.06 per barrel. Oil is lower for the week by - $2.03 /barrel.
- The Dollar Index (DXY) is HIGHER today by + 0.038% at 100.196. The DXY is higher by + 0.923pts for the week
- Spot Gold is lower today by - $12 at $4065 per ounce. Gold is lower for the week by - $19 /ounce
ICE / BofA US HY Index 10-day Average Spread
* HY ETF Fund Flow Data *
Week Ending | Weekly Flow ($) | Weekly Trend ($) |
| Nov 19 | - 982m | - 1.447bn |
| Nov 12 | 465m | 924m |
| Nov 05 | -459m | -2.859bn |
| Oct 29 | $2.40bn | 868m |
| Oct 22 | 1.532bn | 2.233bn |
* HY Managed Funds Flow Data *
Week Ending | Weekly Flow ($) | Weekly Trend ($) |
| Nov 19 | - 333m | + 33m |
| Nov 12 | -366.5m | 589m |
| Nov 05 | -955m | -1.414bn |
| Oct 29 | $459m | 557m |
| Oct 22 | -97.7m | 1.202bn |
Informa High Yield Forward Calendar =============== [ Nov 17 week ] =================== Bond Issuance Summary Table
|