
- Fed cuts for first time in 2025, ECB on hold while BoE lowers once
- September the busiest month of the year so far, most active since May 2024
- Issuance ramps up after Summer to drive Q3 tally
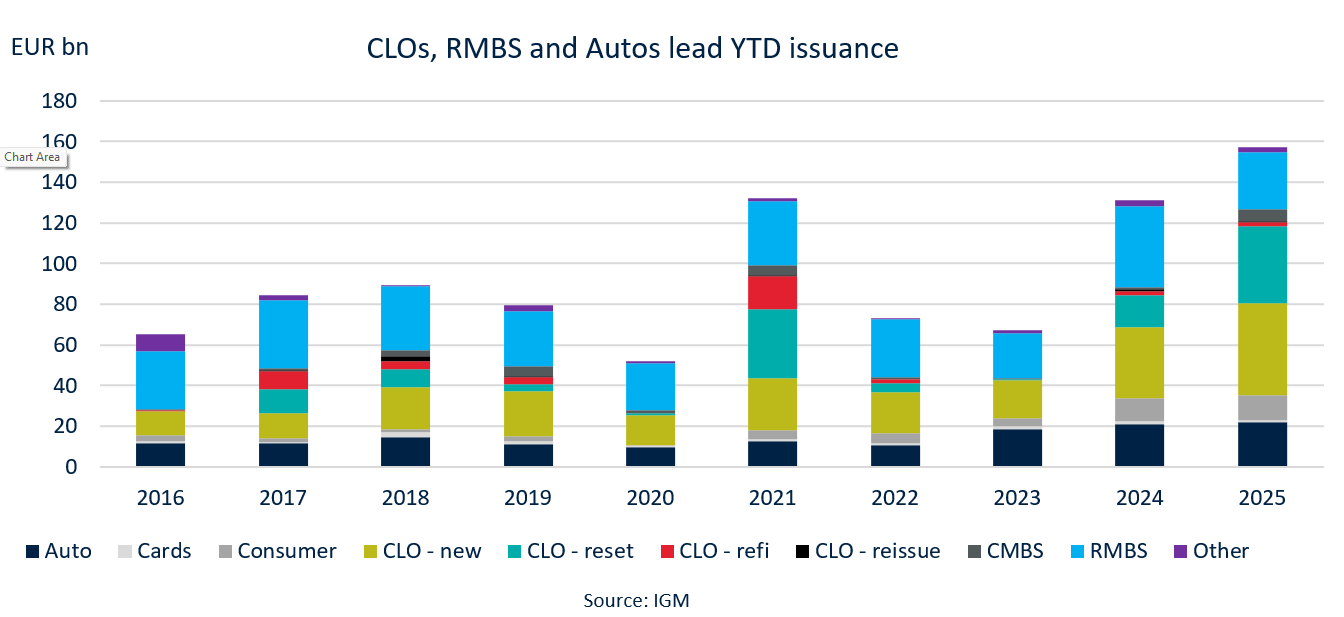
- CLOs the lead category, as new issues and resets provide over half of volumes
_________________________________________________________________________________________
- The third quarter of 2025 saw a change in approach from some central banks. The Fed cut for the first time this year in September by 25bp, with the dot plot suggesting two more rate cuts to come from the 4-4.25% target rate. However, amid intense scrutiny and political pressure from the Trump administration, there are calls to cut rates quicker and deeper.
- Recent labour market reports pointed to a weaker labour market (poor payrolls numbers in Jul and Aug) and a substantial downward revision in the year through March 2025 (-911k), and the Fed said it is closely watching the rising risks from a deteriorating employment situation.
- The ECB was unmoved in Q3, indicating more strongly than previously that the central bank was now in a holding pattern for rates. The Bank of England cut by 25bp in Aug but held rates at the September meeting. The central bank sees inflation edging up in September, having previously predicted CPI touching 4%, before moving back towards target.
- In structured finance, September’s 50 deals for EUR25.6bn made it the busiest month YTD and busiest since May 2024 (post-crisis record of close to EUR27bn). This pushed Q3 into becoming the most active quarter for public deals since the GFC. Across all pricing formats (fully marketed or preplaced, and in CLOs including resets and refinancings as well as new issues), the 2025 Q3 total was 126 deals for EUR60.5bn equivalent, according to IGM figures.
- July had been the busiest month this year with 51 public deals contributing EUR23bn of supply. And August was reasonably active, led by CLOs, with 25 deals placed for EUR12bn. Issuance then took off in September with EUR25.6bn. This was just a little more than EUR1bn off the post-GFC record set in May 2024.
- YTD sales across all asset classes hit around EUR157bn over the first nine months. CLOs, RMBS and auto ABS were the driving force, with new issue CLOs the single biggest contributor YTD with EUR45.5bn or 29% of sales. CLO resets were second with EUR37.6bn or 24%.
Autos in front for STS sales
- YTD STS placement tracking 2024 very closely
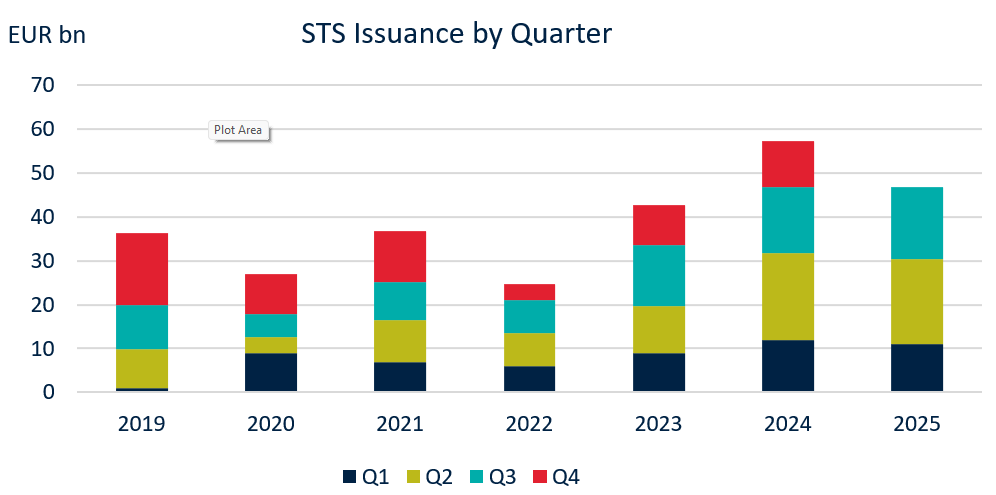
- EUR16.4bn of STS bonds placed in Q3
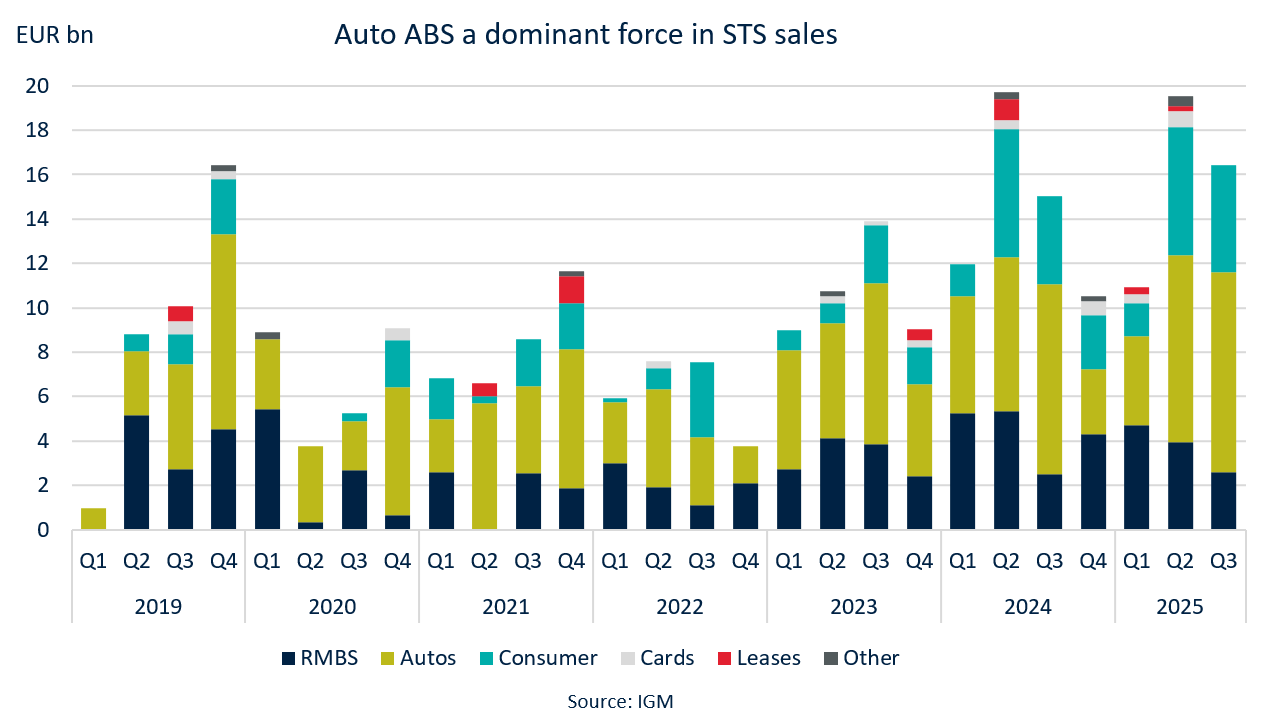
- Auto ABS bonds lead the way with 55% of sales
- Consumer loan ABS in second place, RMBS trails in third
_________________________________________________________________________________________
- Sales of bonds structured to be STS compliant reached EUR16.4bn in Q3 2025. This took the YTD tally to EUR46.85bn, which is remarkably similar to the EUR46.7bn in the equivalent period in 2024. Last year ended with EUR57.25bn of STS sales, which means another EUR10.4bn is needed for that to be beaten and establish a new high. Between 2019, when the label launched, and 2024, Q4 STS supply averages a little over EUR10bn so a repeat of that will bring the FY 2025 very close to 2024.
- The Auto ABS market dominates STS issuance. In Q3 2025, EUR9bn of auto paper was sold with an STS accreditation, or 55% of the EUR16.4bn in the quarter. Consumer loan ABS was second with 29% or EUR4.8bn while RMBS sat in third with 16% from EUR2.6bn. In the FY periods from 2019 to 2024, auto ABS allocations ranged from 41% to 52%.
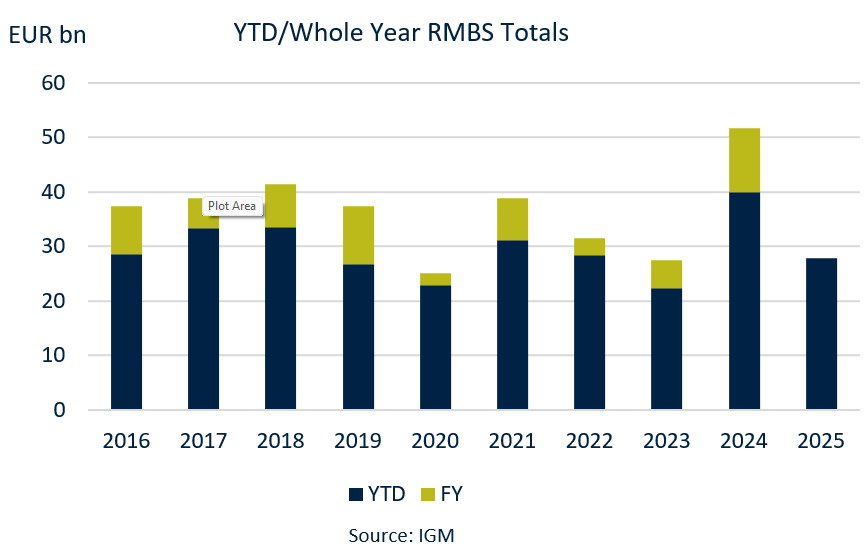
Slower quarter Y-o-Y for RMBS
- Q3 2025 RMBS sales ease to EUR8.1bn from EUR9.16bn in 2024
- YTD sales down 30% against 2024
- Placement exceeded EUR5bn in a month just once in 2025
_________________________________________________________________________________________
- The RMBS market endured a slower Q3, with just 18 deals placed with investors through public marketing or preplacement. The first nine deals of Q3 were all UK trades. Four printed in July, all between 2nd-4th, then three more came in Aug before the market reopened after the summer. Placed bonds aggregated EUR8.1bn equivalent, although the volumes don’t differ significantly from previous years, where the biggest spikes are actually in retained bonds.
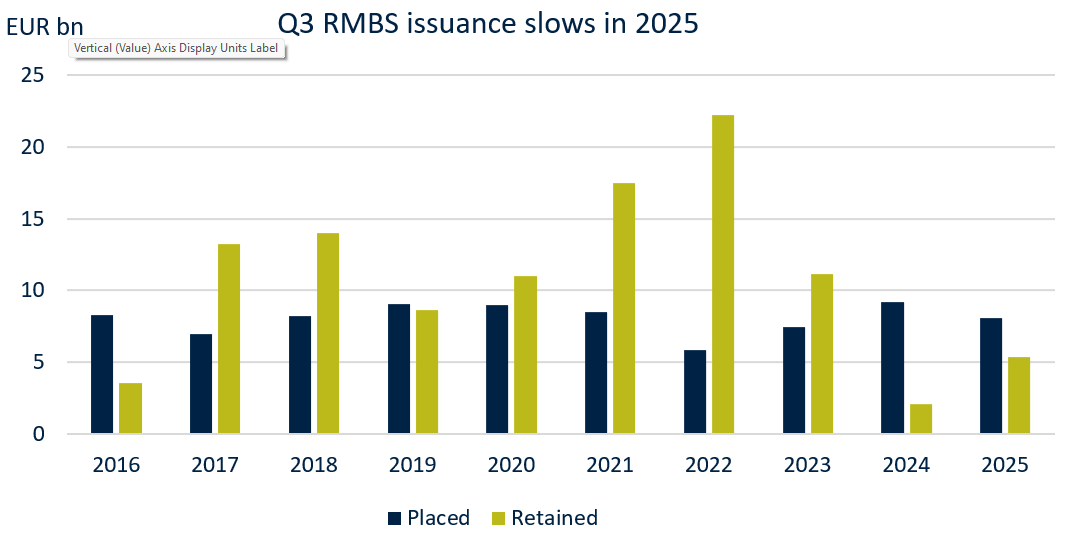
- But in putting 2025 supply into the context of YTD comparisons, the numbers are less aligned with previous years. YTD placed issuance is at EUR27.9bn, down 30% on the EUR39.9bn issued across the first nine months of 2024.
- September RMBS sales were around EUR4.5bn equivalent. In only one month so far this year has issuance topped EUR5bn (EUR7.1bn in February, the current high). Last year there were three EUR5bn+ months in the first nine with the peak at EUR11.2bn in May). In the last ten years, the YTD 2025 total is the fourth lowest, where issuance ranged from EUR22.3bn in 2023 to the May 2024 high.
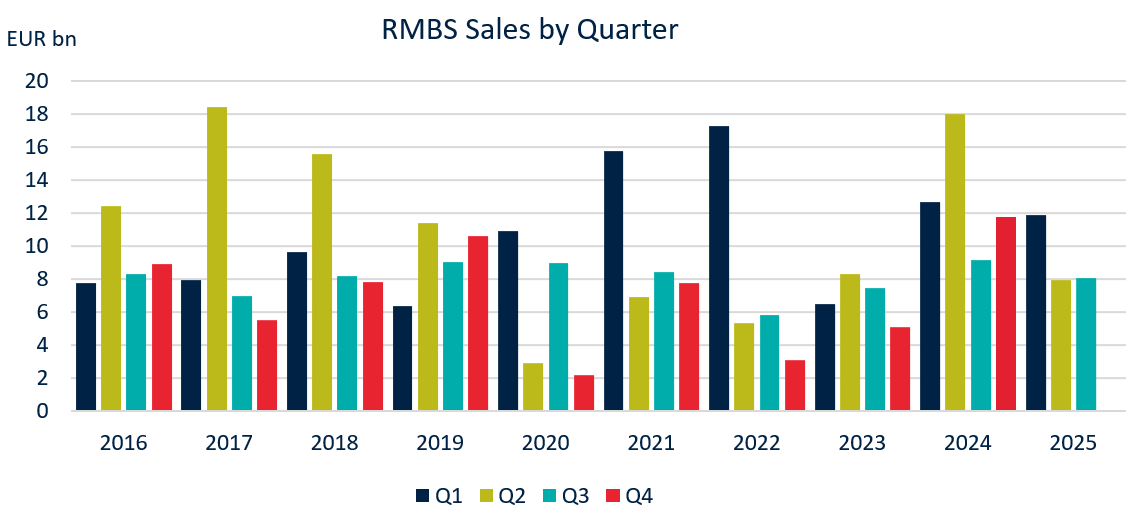
Q3 RMBS in line with Q2, UK sales close to 75% of total
- Q3 2025 issuance of EUR8.1bn up marginally on Q2
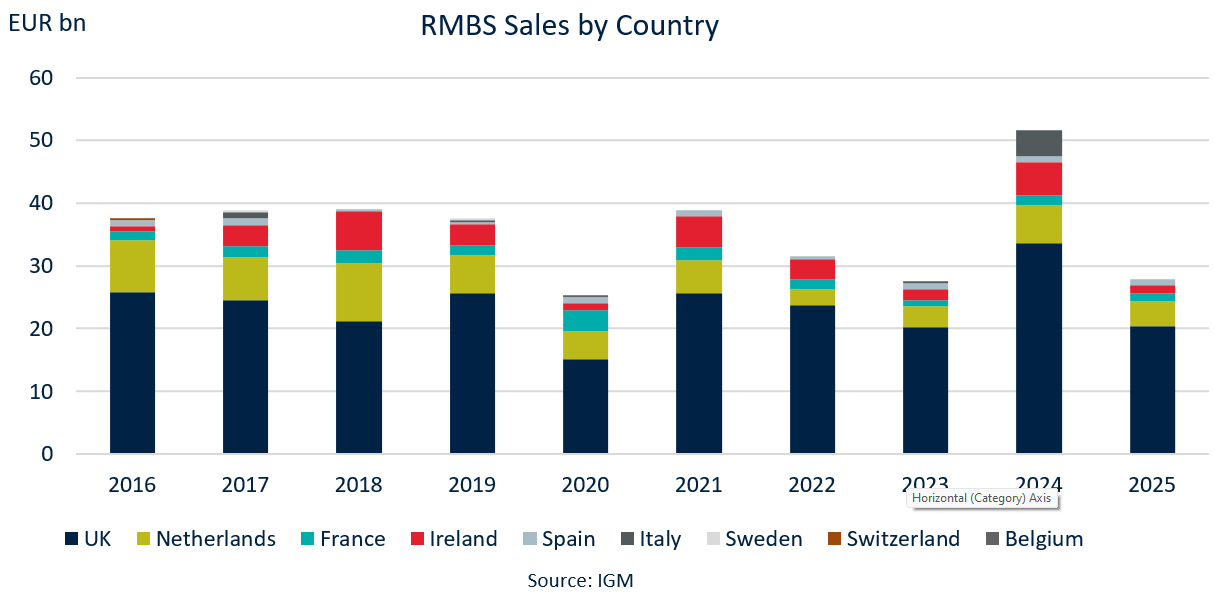
- UK leads market with 73% of YTD sales, Netherlands second and Ireland third
- Potential for UK to end with multi-year high level of dominance based on percentage
_________________________________________________________________________________________
- There was very little difference between Q3 and Q2 2025 figures (EUR8.1bn versus EUR7.9bn) but a decent drop from EUR11.9bn in Q1. In 2024, three of the four quarters had issuance above EUR10bn. Looking back to 2016, the busiest Q3 was last year at EUR9.16bn.
- Between 2016 and 2024, Q4 RMBS placement averaged EUR7bn, dragged lower by poor sales volumes of EUR2.2bn in 2020 and EUR3.1bn in 2022. Q4 2024 was busy, with EUR11.8bn placed with investors.
- The chart below shows full-year figures for 2016 to 2024, and YTD amounts for 2025. Proportionally, the UK market could end up with its highest allocation in the past ten years. Between 2016 and 2024, UK sales accounted for between 54.4% (in 2018) and 75.2% (in 2022) of total European RMBS placement. Across Q1 to Q3 2025, the UK is running at just over 73%. The Netherlands is in second place with 14%, Ireland follows with around 5%, France has just over 4.5% and Spain with a little under 3.5%.
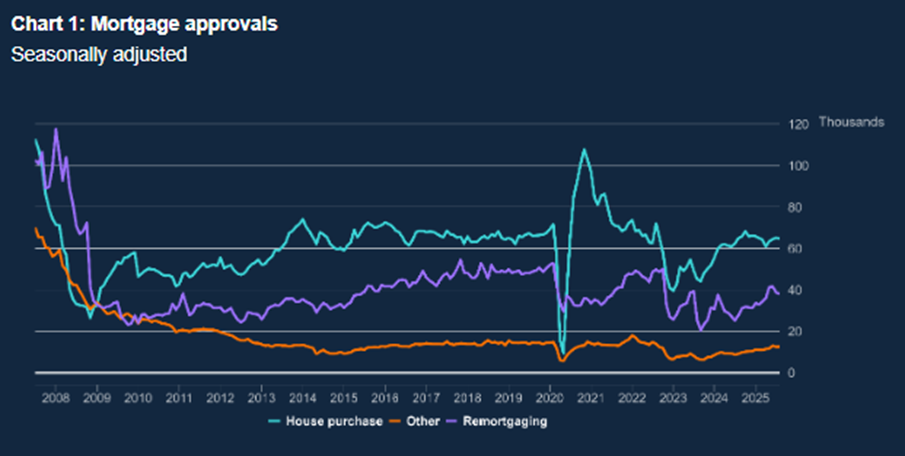
UK mortgage lending maintaining trend, EU improves
- Net UK mortgage approvals tending higher
- Latest survey in Europe shows solid net increase for housing loans
- Germany and Spain lead EU outlook
_________________________________________________________________________________________
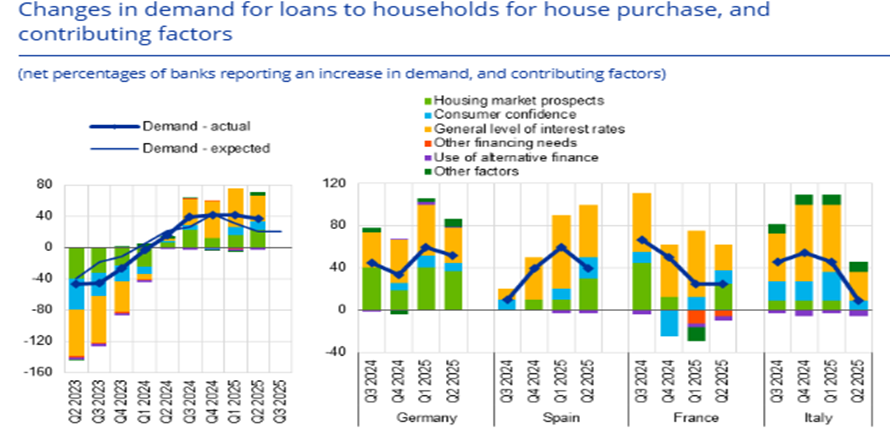
- The UK market continues to dominate the RMBS sector, even if overall transaction volumes have been a little disappointing. As a potential guide for future origination volumes, mortgage approval figures as detailed by the Bank of England for new residential property purchase shows a trend higher since Q4 2023. The most recent data available at the time of writing was for August 2025, showing 64.7k, a slight decline to end four months of increase, but still supporting the trend of recovery.
- In the Eurozone, the ECB’s most recent Bank Lending Survey (published in July) showed a substantial net increase in demand for housing loans at 37%, led by Germany and Spain at 52% and 40% respectively. Lower rates, improving housing market prospects and to some extent consumer confidence were the driving factor. In Q3 banks expected the gain to moderate slightly, but still remain positive at 21%.
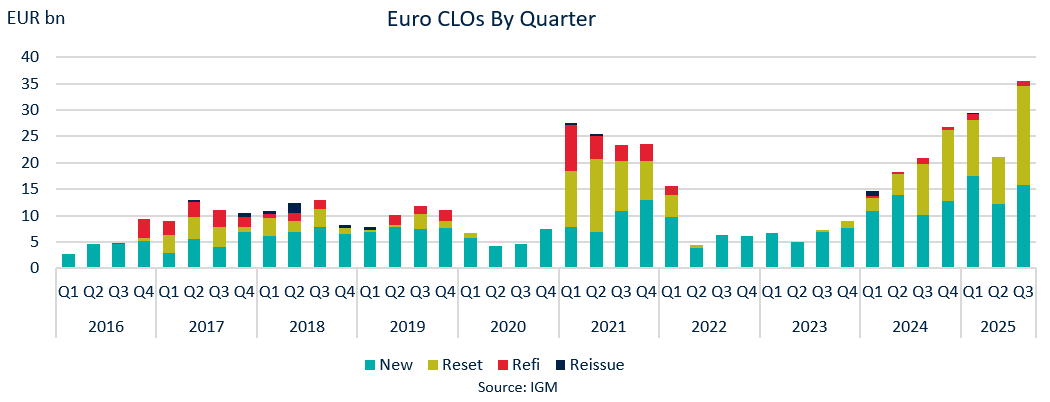
Euro CLO issuance sets record
- EUR5.2bn of new CLOs and EUR5.5bn resets price in September
- Q3 tally pushed to EUR15.8bn, with YTD sales hitting EUR45.5bn
- YTD total across all formats hit EUR86bn, 60% gain on 2024
_________________________________________________________________________________________
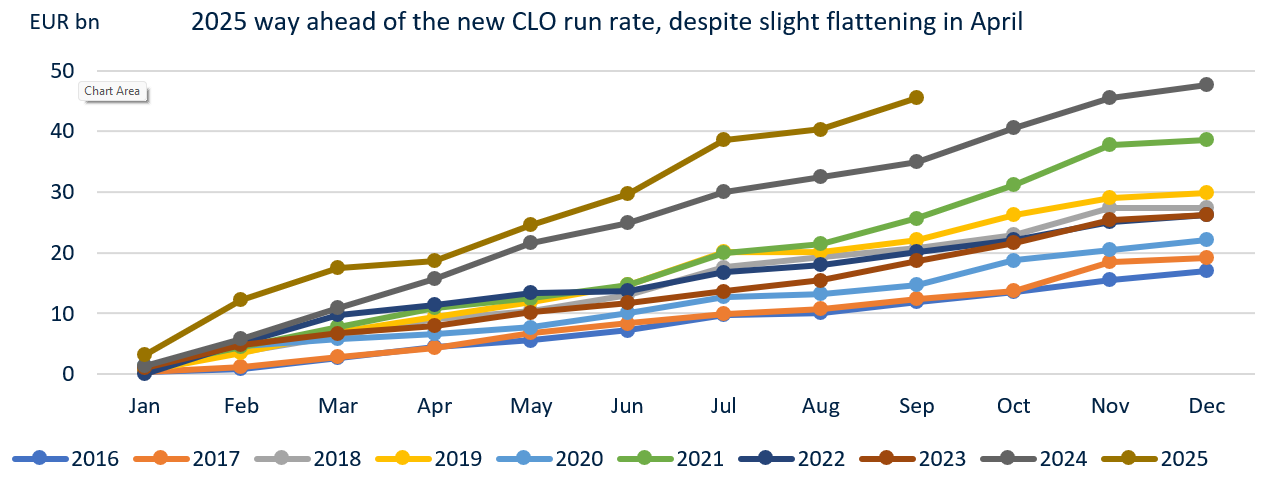
- Euro CLO issuance surged ahead in 2025. The EUR5.23bn of new issuance recorded in September took Q3 to EUR15.8bn, marking the second busiest quarter since 2.0 issuance restarted in 2013. The busiest quarter was Q1 2025, with EUR17.5bn printed, underpinned by EUR9bn coming in February alone. The YTD volume has surged to reach EUR45.5bn.
- September’s total CLO supply hit EUR10.7bn, with EUR5.2bn of that in new issues and EUR5.5bn from resets. This marks a 37% increase on the EUR7.9bn priced in September 2024, which came from EUR2.5bn of new issuance and EUR5.4bn of resets.
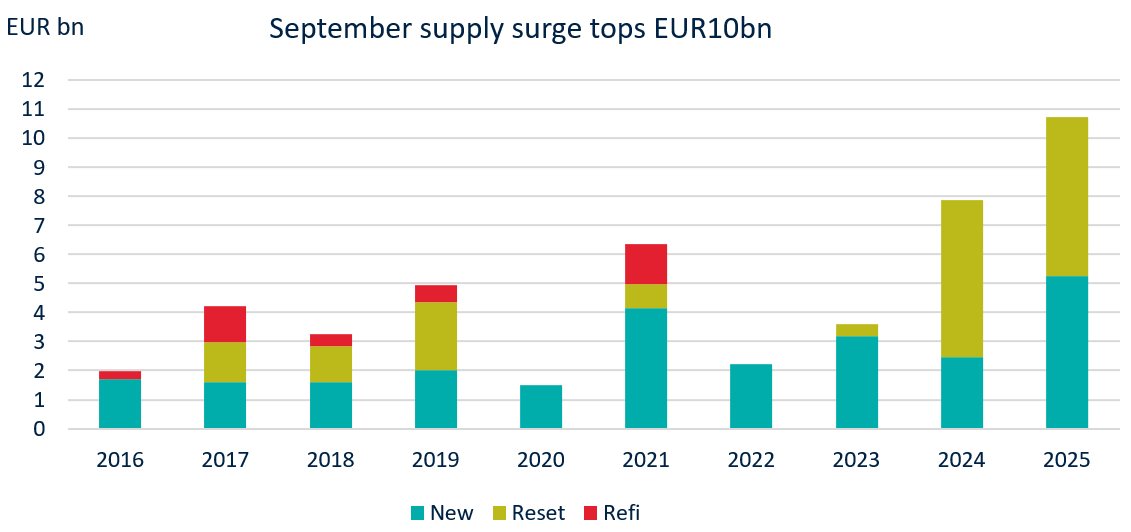
- These deals took the YTD supply across all pricing strategies to EUR86bn, up a huge 60% on 2024 (EUR53.7bn) and a 13% improvement on the next highest total set in 2021 (EUR76.3bn). That year was a lot busier for refinancing, with EUR16bn recorded between Q1-Q3, versus just EUR2.2bn in 2025. However, the exceptional growth in new issues and continued strong use of resets underpins this year’s volumes.
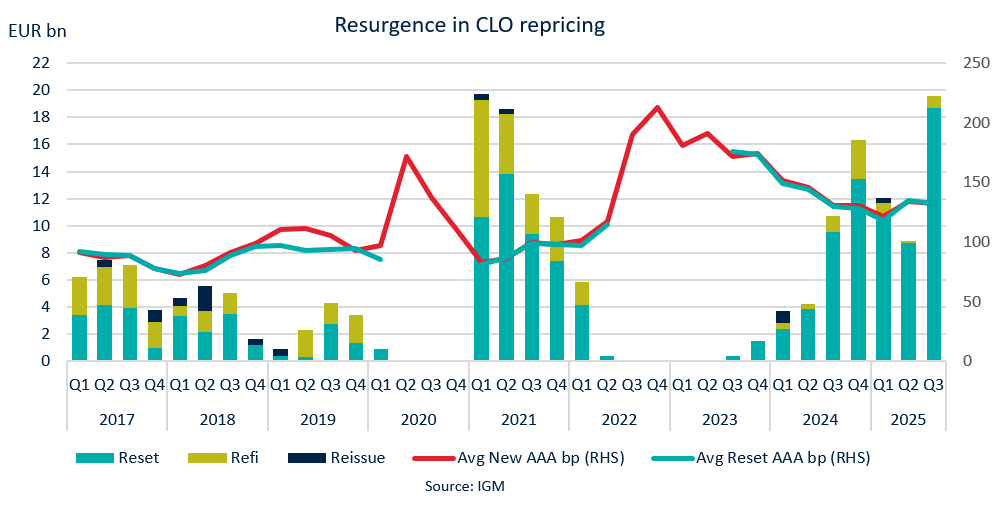
2025 CLOs race ahead of the run-rate
- Q3 new issue sales up 56% on Q2, in which Liberation Day held up April issuance
- EUR2bn more needed to overtake FY 2024 tally, and EUR5bn to hit EUR50bn
- YTD new CLO sales exceeded all FY totals in last decade except 2024
_________________________________________________________________________________________
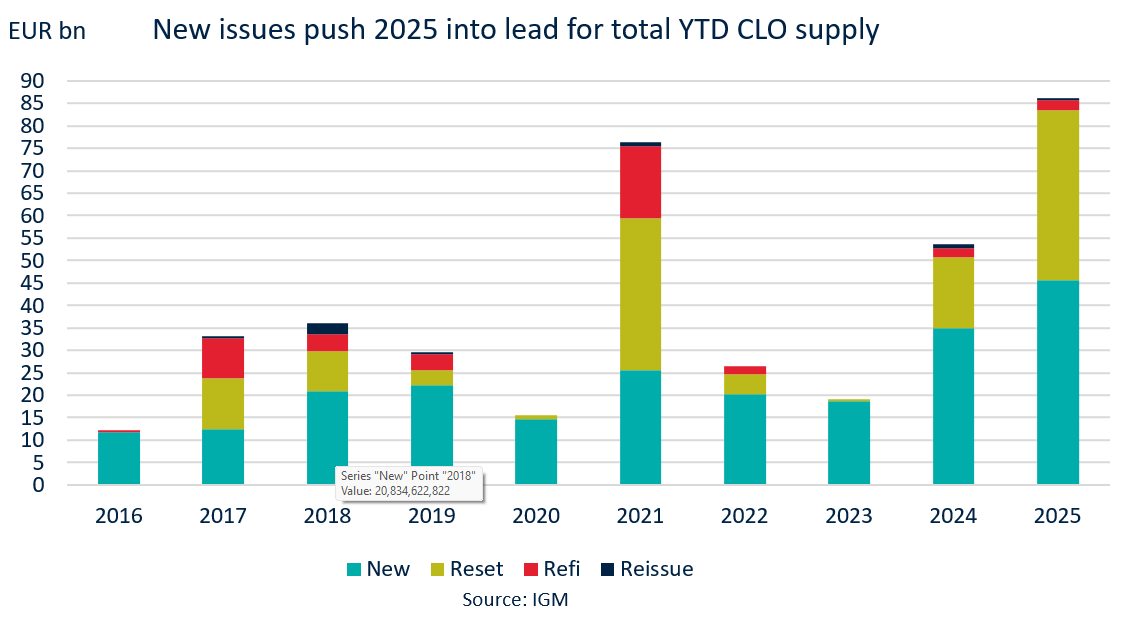
- New issue CLOs recorded EUR15.83bn of sales in Q3, which was up 56% on the EUR12.3bn seen in Q2. Second quarter sales, hindered by April’s Liberation Day announcement, had dropped 30% from the EUR17.5bn seen in Q1. This flattened the trend but the acceleration over the end of Q2 and through Q3 is clear.
- YTD 2025 sales outpace all full year totals in the last decade except 2024, but just over EUR2bn more is needed for that to be beaten and less than EUR5bn to achieve the EUR50bn milestone. With around two and half months of the year remaining, assuming a typically slow end to December, it leaves plenty of time to set a new record, barring any major disruptions.
- A look back over the past decade shows quarterly new issuance volumes beginning to accelerate in 2021, and spreads at multi-year tights encouraged portfolio managers to reprice deals advantageously for them.
- But, several periods of volatility (war, UK mini-budget, banking crises) hampered the market in 2022 and 2023. From 2024, however, there has been an upward trend, culminating in 2025 closing in on EUR50bn of new issuance sales and a significant uptick in resets, as the chart below and those on the next slide show.
Triple A CLO spreads at tightest since pre-Liberation Day
- New issue Triple As tightest since pre-Liberation Day batch
- Non-call and reinvestment periods creep longer
_________________________________________________________________________________________
- In September, managers of new Euro CLOs structured their deals with, on average, 1.66-year no-call and 4.71-year reinvestment periods. For the former, this was the longest since February and the latter since January. Par subordination at the senior level was an even 38% in September, the lowest for several years. Triple A spreads averaged 130.5bp in September, the tightest since the pre-Liberation Day batch of deals.
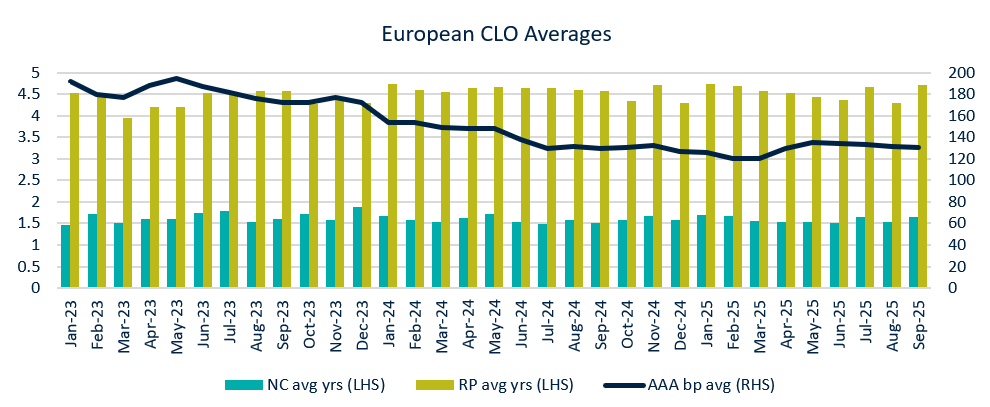
- CLO spreads have been relatively stable so far this year, with even the impact of Liberation Day volatility relatively constrained. New issue CLO Triple A tranches averaged a little over 132bp in Q3, versus 133.75bp in Q2. Reset senior tranches, meanwhile, averaged 132.7bp in Q3, down from around 135bp in Q2. The highest quarterly average was 213bp in Q4 2022, while the tightest over the last decade was around 73bp in Q1 2018.
- The tightest monthly average so far this year was 120.7bp in both February and March, which was the narrowest since May 2022 when 116bp was recorded.
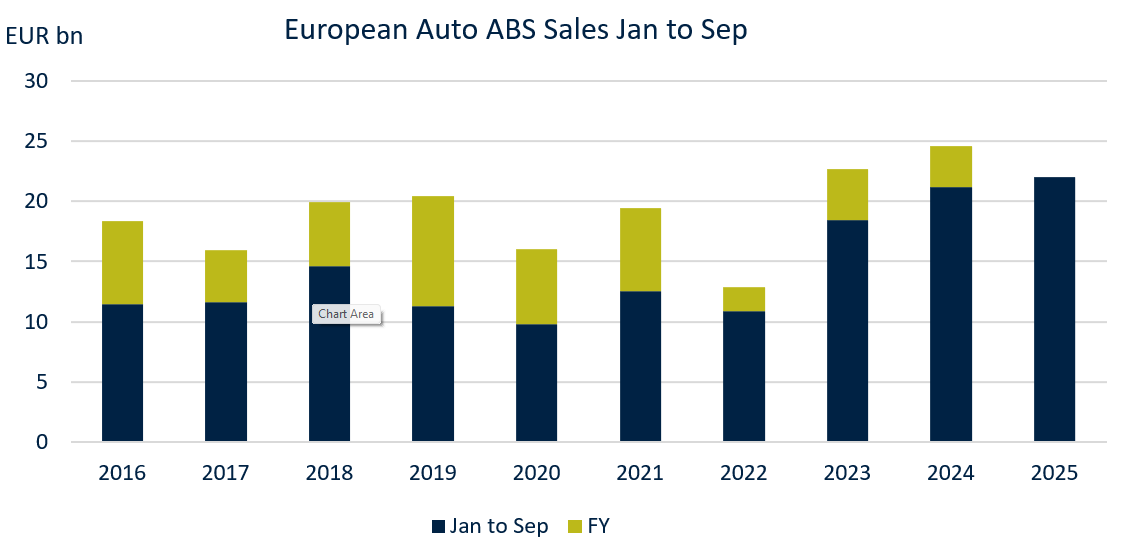
September surge for Auto ABS sales
- Busy September sees EUR6bn of auto ABS, almost double next monthly high
- Q3 auto ABS at EUR9.5bn up 12% on Q2
- 2024 FY total could be beaten in October if average supply level achieved
_________________________________________________________________________________________
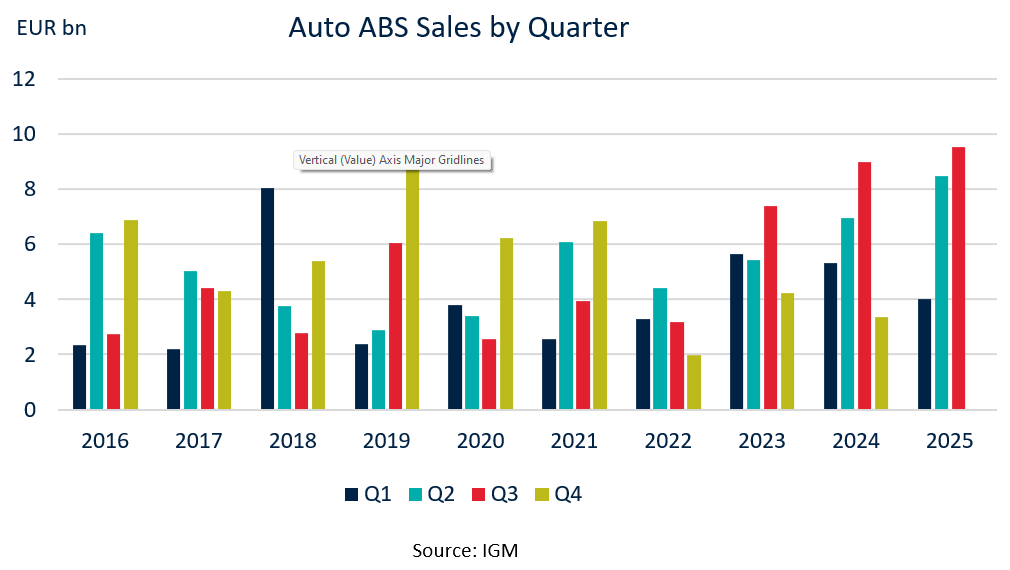
- September was a busy month for the European auto ABS market, with just close to EUR6bn equivalent of bonds placed. It was by far the busiest month YTD (May second with EUR3.3bn) and matched the EUR6bn placed in the same month in 2024.
- This helped Q3 auto sales to EUR9.5bn equivalent, up from EUR8.5bn in Q2 2025 and EUR9bn in Q3 2024. The YTD total across the opening three quarters is now EUR22bn, which is up EUR800m on the EUR21.2bn seen across Q1-Q3 a year ago, and rapidly closing in on the EUR24.6bn FY total for 2024. Between 2016 and 2024, October auto sales averaged EUR3.5bn, and so just one more month may be needed for 2025 auto sales to beat 2024 and in the process set the highest level for at least a decade.
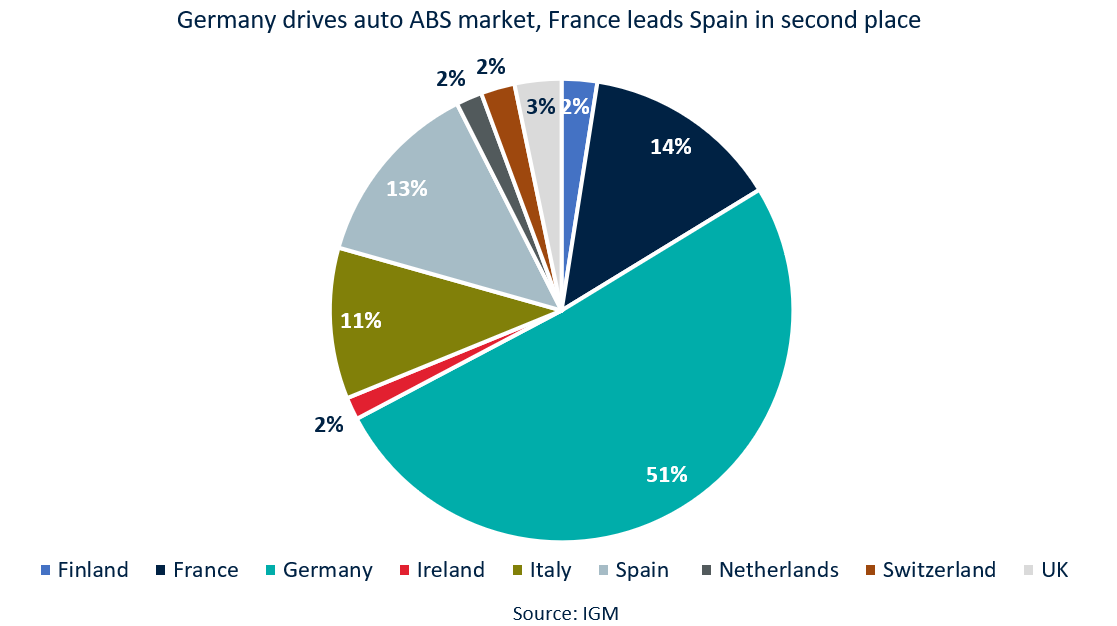
- German collateral is again the driving force behind European auto ABS, accounting for 51% of sales (EUR11.2bn out of EUR22bn). France has moved into second place with 14% from over EUR3bn and Spain sits in third spot with 13% or EUR2.9bn.
Quarterly auto sales trend higher
- Q3 issuance of EUR9bn continues upward trend
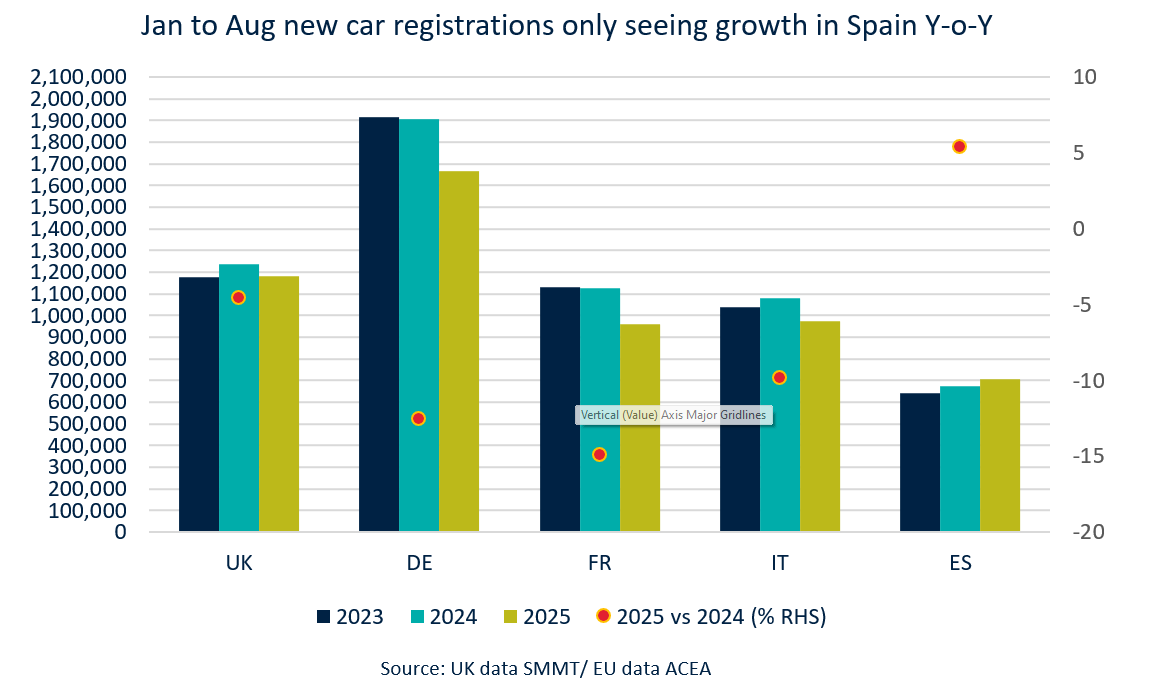
- YTD new car registrations rise in UK, Italy and Spain but fall in Germany and France
_________________________________________________________________________________________
- The September transactions took Q3 supply to just under EUR9bn, the highest quarterly figure since Q4 2019 when EUR9.1bn was recorded. The third quarter of 2024 represented a 22% increase on the EUR7.4bn placed in Q3 2023, and as the chart below shows it marked an increase q-o-q across the first three quarters for the first time since 2019 too. Some EUR5.3bn was placed in Q1 of this year, followed by EUR6.9bn in Q2.
- In four of the last eight years, Q4 has been the busiest quarter of the year, although this last happened in 2021. The quietest final quarter in recent years was in 2022, when just EUR2bn printed, of which almost all was in October and November.
- As for the underlying assets, and a potential future guide to origination levels, new car registrations show YTD declines in each of the UK, Germany, France and Italian markets (YTD values ranging from -4.6% in the UK to -14.9% in France). Only Spain of the major auto ABS jurisdictions has posted a gain (5.4%).
Consumer loan and CMBS issuance rises
- YTD consumer loan ABS supply exceeds EUR12bn
- Italian issuers top the list with over 33% of sales
_________________________________________________________________________________________
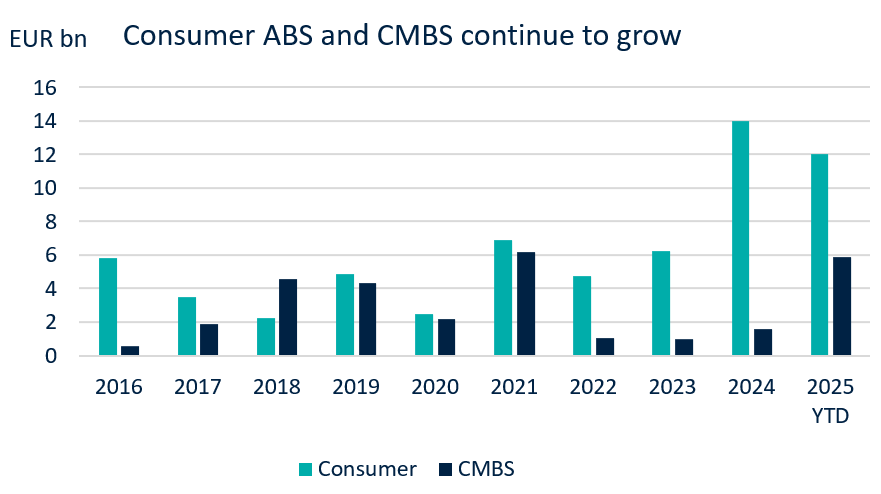
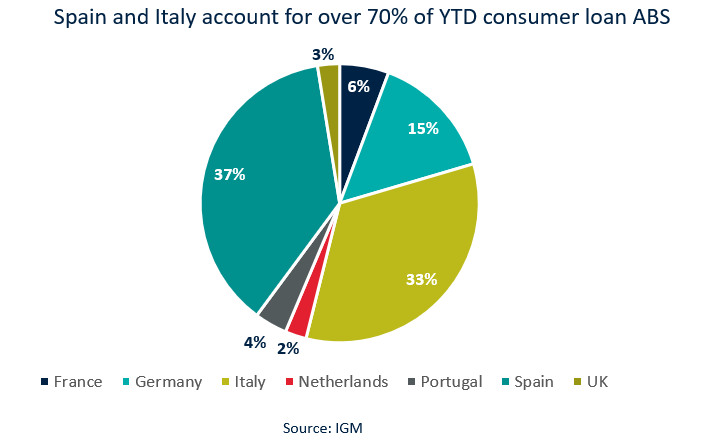
- In other asset classes, consumer loan ABS is playing a much bigger role while issuance in the CMBS sector has also gathered pace. As of the end of September, over EUR12bn of consumer paper had been sold to investors, catching up to the EUR14bn FY tally in 2024 which was more than double the previous highs of EUR6.9bn in 2021 and EUR6.2bn in 2023.
- CMBS sales are at EUR5.9bn equivalent, just one deal away from beating the post-GFC high of EUR6.2bn set in 2021. And with a new issue due the first week of October, it will take 2025 supply through that 2021 level with over two months of the year left to build that lead.
- Of the 12 CMBS carried out so far this year, eight have been UK deals. The four EUR deals have come from Ireland, two were multi-jurisdiction (one backed by French and German assets, the other by properties in Frace, Finland, the Netherlands and Germany) and a rare Spanish trade.
- September was busy for consumer loan ABS with EUR4.1bn printing, taking the Q3 tally to EUR4.8bn (the only other deal in the third quarter was in July). Southern European issuers are the dominant players in this market, with Spanish supply at EUR4.5bn (37%) and Italian at EUR4bn (33%). The next biggest contributor is Germany with EUR1.78bn (15%). France, Portugal, the UK and the Netherlands make up the residual amount.
To receive this analysis plus much more, subscribe to IGM. Request your free trial of the service today.