
The trend is pretty strong, with eight positive years out of the last nine.
In February so far, the USD is largely a winner (following the sharp late-January selloff amid speculation of Japan MOF YEN buying USD selling speculation as well as possible direct or indirect help from the States), as next Fed Chair Warsh has been perceived as hawkish of late.
So far, the USD has lost out against just (the relatively sheltered from the geopolitical storm?) NZD and AUD at -0.2% and -0.5% respectively. Most acute USD gains have been made vs +0.6% NOK, +0.7% CHF and +0.8% YEN.
The questions as ever though seasonality wise is how does the Dollar tend to perform during the second month of the year and are there any G10s that seem to perform particularly well/badly through February?

See image above. Last year, the USD was mostly a loser. Most acute USD came against the -1.5% GBP, -2.9% SEK and -3.0% YEN. Sole USD wins were +0.1% AUD, +0.6% NZD.

In 2024, the USD lost ground against just the -0.2% SEK. Elsewhere, the USD won out in G10 land, most acutely against +2.0% YEN and +2.6% CHF.

- See table above. In 2023, the USD was a broad winner. Biggest wins came against +3.8% NOK, +4.0% NZD, +4.5% YEN and +4.6% AUD.
- In 2022, the USD was largely a loser. with largest losses coming against -0.1% CHF, -2.8% AUD and -3.0% NZD. Only material USD win came against the +1.6% SEK.
- In 2021, it was a mixed month. Material USD losses came against -0.8% AUD and -1.6% GBP, with top USD gains being +1.2% NOK, +1.8% and +2.0% CHF.
- In 2020, the USD was mainly a winner, losing out minimally against -0.2% SEK and -0.4% YEN. Biggest USD wins came against the +2.6% AUD, +2.9% GBP and +3.4% NZD.
- In Feb 2019, the USD only lost out to the +1.2% GBP. Elsewhere there were mostly light gains, most acutely between +2.1 and 2.5% SEK, YEN and AUD.

- In 2018, see above, the USD was again a near broad winner. Only losses were vs the -2.4% YEN, with decent size gains from +1.4% CHF to +3.0% GBP, +3.6% AUD, +4.0% CAD and +5.0% SEK.
- In 2017, almost the same. The USD only lost out vs the -1.0% AUD. Otherwise, it was gains between +1.6% GBP, NZD and CHF to 2.0%-plus CAD and EUR and then +3.3% SEK.
- In 2016, a reversal of fortunes. Mostly USD losses, biggest vs -1.6% NZD, -2.5% CHF, -3.2% CAD and -7.5% YEN (as concerns over slow global growth and volatile oil/financial markets prompted investors to seek shelter in the low-risk/low return safe haven king). Tiny USD win vs +0.2% NOK and largest +2.3% GBP.
- In 2015, very mixed. USD losses from -0.6% AUD through to -1.7% CAD, -2.5% GBP and -4.2% NZD. USD wins include from +0.6% SEK, +1.8% YEN and +3.6% CHF.
- In 2014, see above, it was USD losses across the board, with most acute seen vs -3.8% NZD and -4.6% NOK.
- In 2013, see above, the opposite. USD gains across the board, from +0.9% YEN through to +3.8% EUR, +4.4% GBP and +4.8% NOK.
- In 2012, back to mostly USD losses from -0.9% NZD through to -1.8% CHF and EUR, -2.7% SEK and -4.9% NOK. Only USD gains seen vs the +6.0% YEN. USD/JPY supported by BOJ easing, Japan's shrinking C/A surplus and trade deficit amid signs of economic recovery in the US.
- A quieter month in 2011, but mainly USD losses from -0.3% YEN through to -2.1% AUD, -3.0% CAD and -3.2% NOK. Only USD victory vs the +2.7% NZD.
- In 2010, very mixed again. USD losses from -0.3% NOK through to -1.8% CAD and -3.7% SEK.USD wins include vs +1.2% CHF, +1.7% EUR and +4.7% GBP.
- In 2009, tiny losses vs -0.2% AUD, with USD gains everywhere else incl big ones +7.5% SEK and +7.9% YEN.
- In 2008, USD losses across the board, from -0.1% GBP through to -3.0%-plus SEK, NOK, and -3.9% CHF and AUD.
- In 2007, mostly USD losses, most acutely -1.8% NOK and YEN and -2.0% CHF. Mini USD gains only versus +0.1% GBP and +0.7% SEK.
- In 2006, a change of scenery with the USD only losing out against the -0.2% CAD and -1.2%. Elsewhere, material USD gains versus +2.1% AUD, +2.6% CHF, +3.9% NZD and +4.1% SEK.
- In 2005, about turn again. Mostly USD losses, from -0.5% CAD through to -2.0%-plus against GBP, AUD, CHF and NZD through to -2.4% NOK. Only USD win came vs +0.9% YEN.
- In 2004, a mixed bag again. Biggest losses came vs -2.0% NZD and -2.5% GBP. USD wins came via the +0.1% SEK through to +3.1% YEN.
- In 2003, mostly USD losses, from -0.4% EUR through to -2.4% CAD, -2.7% NZD and -3.7% AUD. Decent USD wins panned out vs +3.4% NOK and +4.5% GBP.
- In 2002, a similar story. USD losses for the most part, largest being -2.1% AUD and SEK and -2.8% NOK. Sole USD win was +0.8% CAD.
- In 2001, USD upside across the G10 board. From +0.7% YEN through to +3.0% NZD, +3.4% SEK and +4.4% AUD.
- For good measure, in 2000, mini USD losses only against wait for it the -1.2% SEK. USD gains everywhere else, from +0.1% CAD through to +2.3% GBP, +2.7% YEN and +3.0% AUD.
A mixed bag then.
The USD tends to move in sync, with not too many mixed months. In the last ten years, there has been a trend of outsize losses suffered by the Antipodeans and Scandi FX. Interestingly, all four (AUD, NZD, NOK and SEK) were relative outperformers last month.

See table above, the DXY USD Index has gained a little, on ave +0.3% per month since 2000 during Februarys. The trend is pretty strong, with eight positive years out of the last nine.
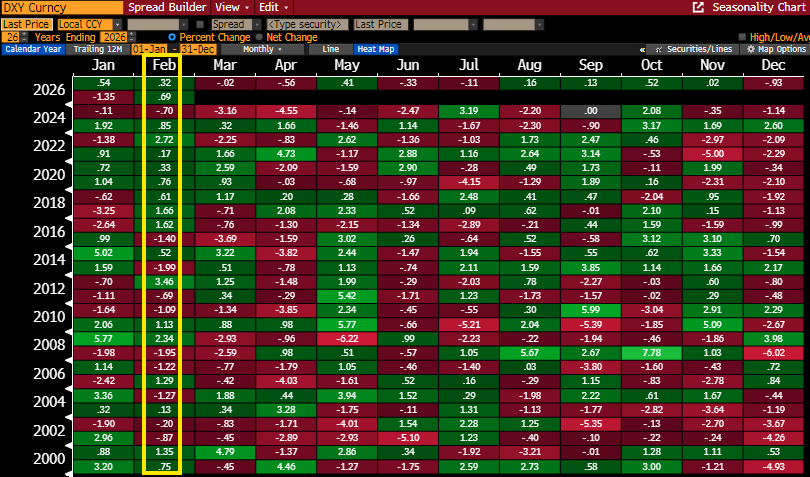
Over the same period, best USD gains have come against GBP. Cable is down -0.7% per month on ave since 2000. Trend wise, Cable fell in seven of the previous ten Februarys. Note February has proven to be GBP/USD's second worst month of the calendar year over the last 26 years.
A new add for 2025, see table below - The USD's performance on average vs each G10 since 2000 in Februarys.