How is USD performing?

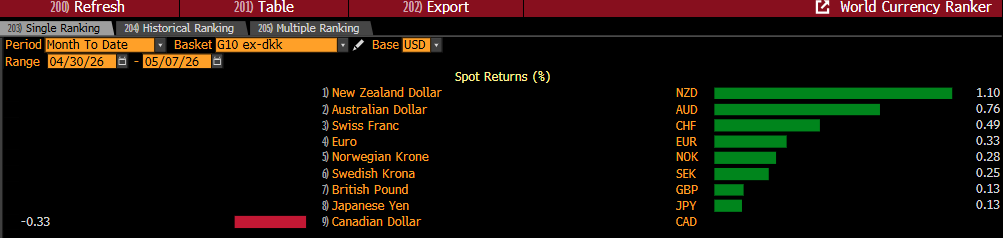
The USD is mostly a light loser in May amid war end hopes, with biggest losses coming against -0.5% CHF, -0.8% AUD and -1.1% NZD. Sole USD gains so far are the +0.3% CAD (as the OIL price falls).
How about May generally? Does this month tend to bring USD outperformance or do seasonal trends result in losses? Also, are there any other G10s that perform particularly well or badly in the month of May?
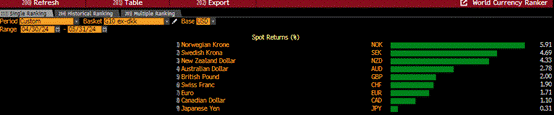
Last year, see image above, the USD was largely a light loser, most acutely vs -0.7% SEK, -1.0% GBP and -1.9% NOK. The sold USD win in May 2025 came against +0.7% YEN.
So far in May 2025, the USD is a broad winner on a softer negotiation phase of the Trump tariffs, with gains most acute vs +0.4% CHF, +0.6% SEK and +1.1% YEN, the latter in the wake of a less than hawkish Bank of Japan monetary policy meeting.

- In 2024 see image above, the USD was an across the board material loser, with downside largest vs -4.3% NZD, -4.7% SEK and -5.9% NOK.

- In 2023, see image above, the USD was an across the board winner. See above, largest USD gains came vs +2.6% NZD, +3.0% EUR, +3.9% NOK and +5.5% SEK.
- In 2022, , the USD was a fairly small loser across the board, up to -1.6% CAD and AUD and -1.8% EUR.
- In 2021, the USD was on the back foot for the most part, from -1.2% NZD through to -1.9% SEK and -2.7% GBP. Main USD wins came against +0.5% YEN and NOK.
- In 2020, the USD was mainly a loser, most acutely -2.4% AUD, -3.5% SEK and -5.4% NOK. Only USD wins came against +0.6% YEN and +2.0% GBP.
- In 2019, the USD lost out to (other havens) the CHF and JPY to the tune of -1.9% and -2.9%. Elsewhere, broad USD gains most notably +1.5% NOK, +1.6% AUD, +2.2% NZD and +3.1% GBP.
- In 2018, a similar picture. Mini USD losses of -0.5% vs JPY, AUD and CHF, with gains everywhere else. Biggest came against +2.0% NOK, +3.2% EUR and +3.4% GBP,
- In 2017, the USD was a near total loser, from -0.6% JPY through to -2.8% CHF and -3.2% NZD and EUR. Only USD gains made were vs the +0.5% GBP (again) and the +0.8% AUD.
- Ten years ago, see above, the reverse, the USD won out everywhere, from +0.9% GBP to ~+4.0% JPY, NOK and CAD up to +4.9% AUD.
- In 2015, the USD was again an across the board winner, from +0.4% GBP,+2.0%-plus EUR and SEK, +3.0%-plus CAD, NOK, AUD and JPY through to the RBNZ weighed +6.7% NZD.
- In 2014, it was a more mixed picture. Light USD losses were seen of -02% to -1.1% vs AUD, JPY and CAD , with USD gains elsewhere, from +0.4% NOK, +0.7% GBP and +1.7% CHF and EUR through to +2.8% SEK.
- In 2013, again USD gains across the board, from +1.3% EUR, +2.2% GBP to +3.0% JPY and then the beleaguered Antipodeans +7.2% NZD and +7.7% AUD.
- In 2012, only the (-1.9%) YEN won out vs the USD. Apart from that, material USD gains everywhere else, incl +5.1% GBP, ~+6.5% NOK, CHF, EUR and AUD, then +7.5% SEK and +7.9% NZD.
- In 2011, it was another relatively strong USD period. Light losses were incurred (-1.3%, -1.7%) vs CHF and NZD . USD victories everywhere else in G10, ie +0.4% JPY, +1.6% GBP, ~+2.5% NOK, AUD and SEK, with highest vs +2.8% EUR.
- In 2010, the USD lost out vs the -3.1% JPY. Elsewhere, all USD gains, from +3.5% CAD to +5.3% GBP, +7.0%-plus CHF, SEK and EUR and then +8.3% AUD to the top +9.0% NOK.
- 2009 the relative outlier. The contrarian month. A heavy Usd reversal. The USD lost across the board, between -3.5% JPY to -9.5%-plus GBP, -10.4% AUD and -13.3% NZD.
- 2008 was also a bit different. Relatively quiet trade, with fair USD losses vs -1.3% AUD and -1.5% CAD. USD gains included +0.2% GBP, +0.8% CHF and +1.5% JPY.
- In May 2007, a quick return to trend. Sole USD loss the -3.8% CAD. Elsewhere, USD gains included +1.0% GBP, +1.8% JPY and +3.2% SEK.
- Twenty years ago, mostly USD losses, the highest -1.6% SEK and CHF and -2.4% GBP. Only USD gains came against +0.7% NZD and +1.0% AUD.
- In 2005, the -0.3% CAD was the sole Dollar loss. Elsewhere, USD gains from +2.2% NOK through to between +4/5% against SEK, CHF, EUR and GBP.
- In 2004, mostly USD losses, most acutely -3.1% GBP and -3.5% CHF. Sole USD win came against the +0.9% AUD.
- In 2003, swiftly back to trend and near full USD gains, from +2.4% GBP through to +4.7% CAD and NOK and +5.4% SEK and EUR.
- In 2002, almost the same. Only USD losses came against CHF and -2.9% EUR. Biggest USD wins vs +3.2% GBP and +5.7% NZD.
- In 2001, the USD lost out only vs -3.6% YEN. Elsewhere, there were USD, especially against +3.6% CHF, +4.9% EUR and +5.0% SEK.
- For good measure, 2000 was mixed. Material USD downside seen vs -2.1% CHF and -2.9% EUR. Largest USD gains came against +2.0% AUD, +3.2% GBP and +5.7% NZD.
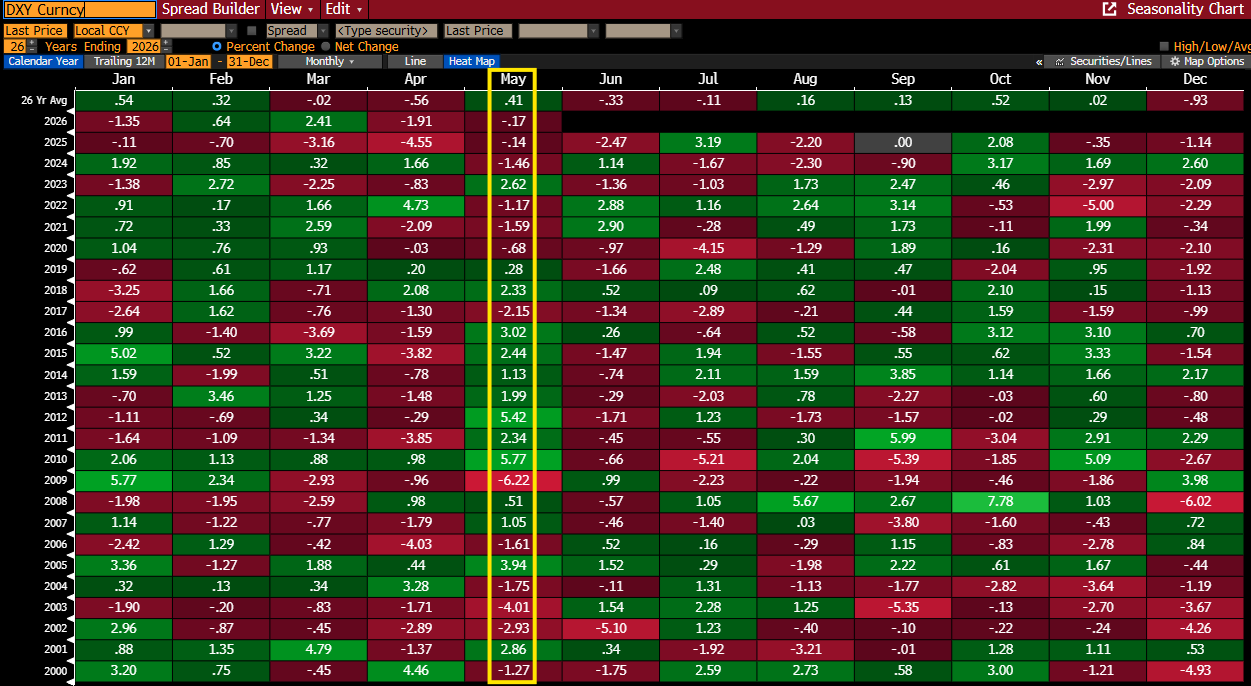
See image above, the DXY USD Index has gained on ave +0.4% per month in May since 2000. However, the trend has been more negative in most recent years, printing five of six negative reads since 2020.
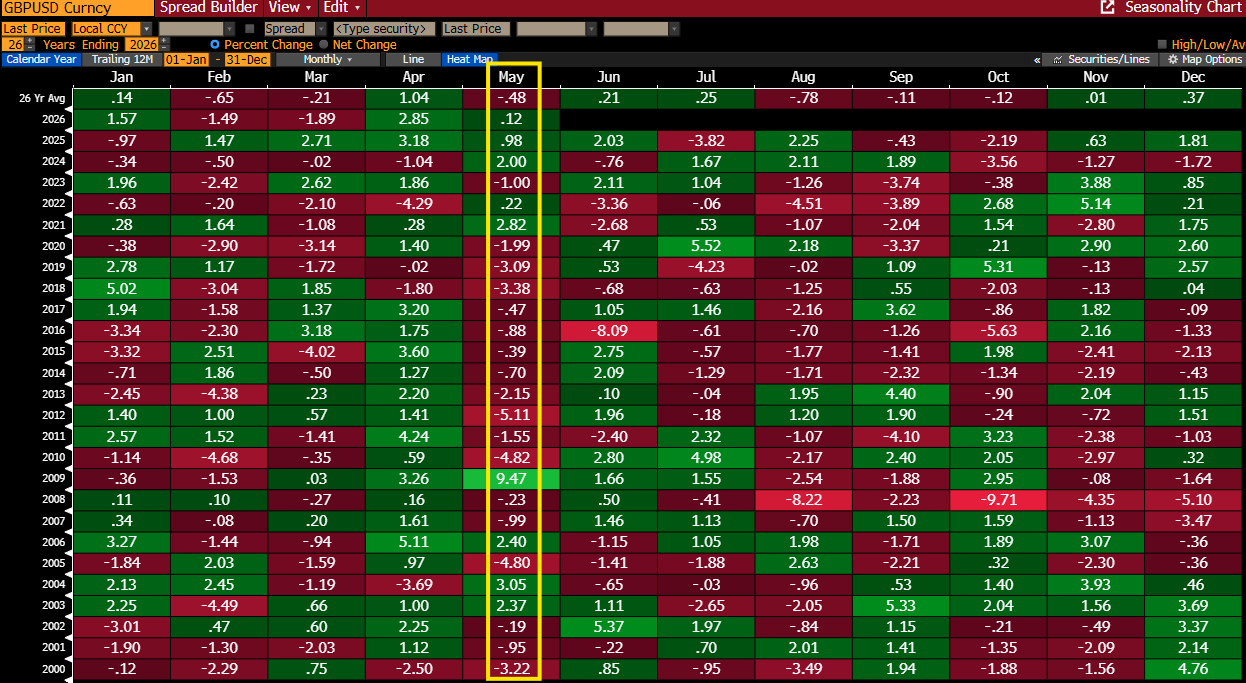
From the above findings, we can also see that May can prove GBP/USD negative, to the tune of -0.5% p/m on ave during the period. Cable has fallen in 12 of the previous 16 Mays though the Pound has gained in the last two!.
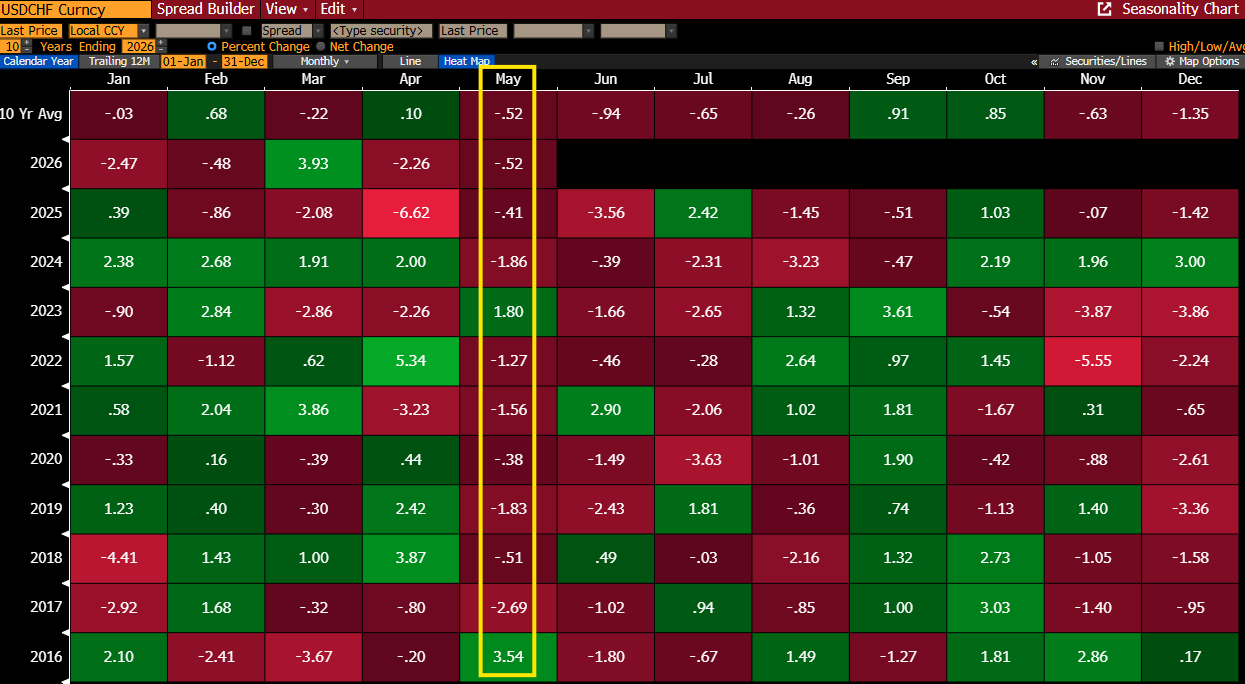
See image above. USD/CHF is worth a mention, falling -0.5% per May on average since 2016 and has posted negative reads in seven of the last nine years.
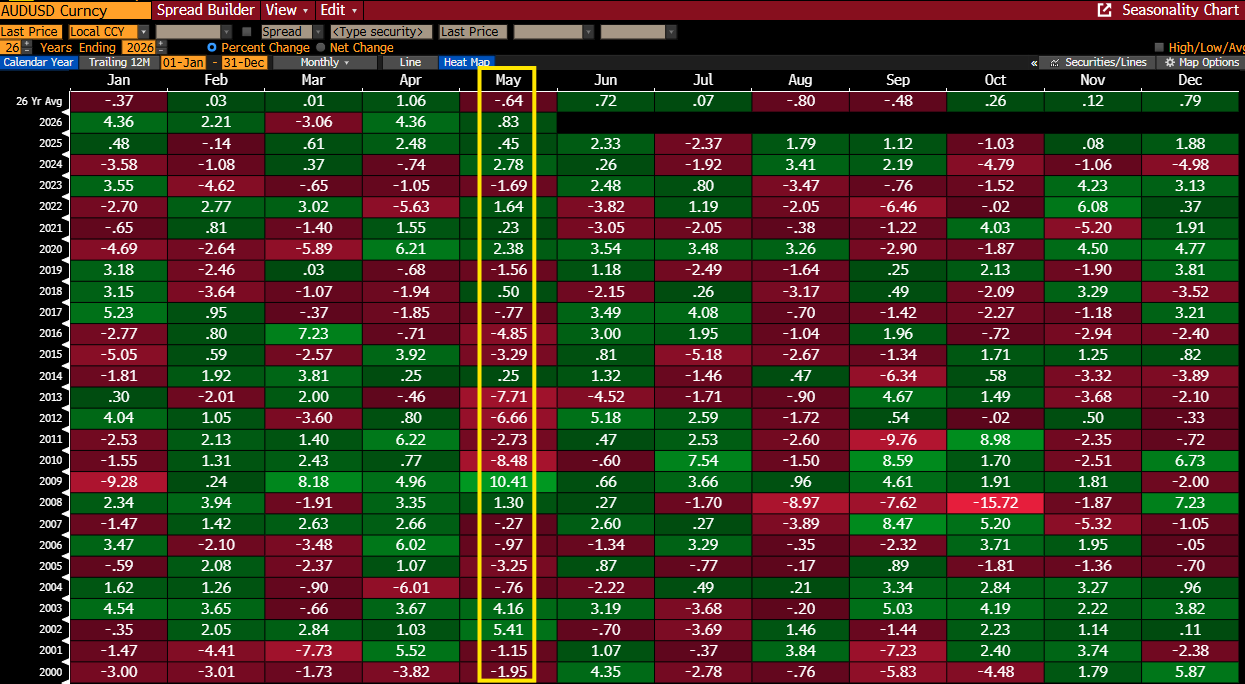 Also see table above. Another interesting market is AUD.
May tends to be the second worst performing month for AUD (coinciding with downward seasonality for some commodity price indices) and is a -0.6% p/m on ave loser in Mays since 2000. However, again, there has been a reversal of sorts in recent years, with five of the last six Mays being positive.
Note we are now adding a table stretching across two timelines - The USD's performance on average vs each G10 since 2000 in Mays.
| DXY USD Index | AUD/USD | USD/CAD | USD/CHF | EUR/USD | GBP/USD | USD/NOK | NZD/USD | USD/SEK | USD/YEN | |
| Since 2016 | +0.1% | -0.1% | -0.1% | -0.5% | +0.1% | -0.5% | -0.3% | +0.3% | -0.3% | +0.3% |
| Since 2000 | +0.4% | -0.6% | -0.3% | +0.1% | -0.4% | -0.5% | +0.4% | -0.4% | +0.6% | - |