
CORP VIEWPOINT: EUR supply volumes lowest since 2014 in challenging year
13 Dec 2022 | Matthew Barrett
EUR supply volumes lowest since 2014 in challenging year
Seasonal factors are taking a stronger hold as we get further into December and Tuesday is set to become the eighth consecutive session without any single currency IG corporate bond activity.
With the distraction of today's US CPI print (that was lower than expected) ahead of the key FOMC and ECB verdicts due tomorrow and Thursday respectively, the expectation is that we are now finished for the year in terms of single currency supply for the asset class.
The likely end of supply provides a chance to look back on what was a much more measured year for corporate activity, amid a cocktail of factors that impacted investor appetite and limited issuance windows for borrowers.
In the end we saw euro single currency corporate (excluding high yield) supply worth EUR247.345bn which marks a second consecutive year of slowing volumes and the lowest annual total since 2014 when just EUR245.65bn priced.
That compared to EUR329.988bn in 2021 which was the third highest annual total on record and even further adrift of 2020's record-breaking EUR443.5145bn which was the first time ever that the EUR400bn mark was surpassed in a single year.
Annual IG/Split Rated Euro Corporate Supply

This year's fall in activity came despite what was another bumper year for ESG corporate supply which tallied EUR89.02bn, just shy of last year's record-breaking EUR92.17bn. That means ESG supply accounted for some 35.99% of 2022's overall corporate haul, compared to 27.93% in 2021 (something we will look at in more detail later in the week).
The slowdown in the corporate arena contributed to what was a more measured year on the whole for euro bond activity with EUR1.22tn having priced across all asset classes in 2022, down from the EUR1.39tn in 2021 and 2020's all-time high of EUR1.48tn.
As previously alluded to, it is not hard to find reasons why absolute volumes were down this year – not least geopolitical events and in particular the Russian attack on Ukraine which started toward the end of February and put pressure on global assets.
That combined with ongoing Covid-19 cases and associated lockdowns (especially in China) fanned growth worries, whilst focus has also been on global central banks hiking rates to counter inflation.
Another reason for the reduction in corporate supply is due to the fact that many corporates were still sitting on decent cash piles having made hay while the sun was shining, and locking in funding during prior years.
With all-in costs also rising, some companies were also put off hitting the bond market this year, with them either finding alternative sources of funding or deciding to wait for costs to come down.
March stands out in stop-start year
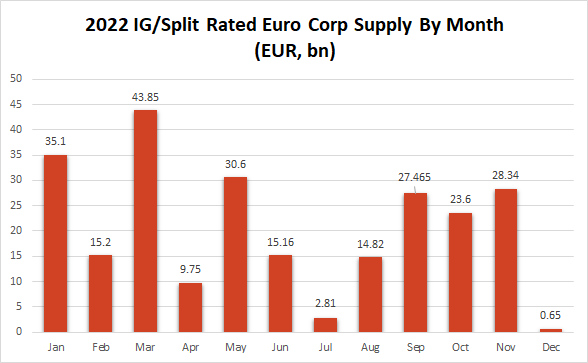
As shown by the chart below it was a very stop-start year for activity with January getting 2022 off to a typically active start where the EUR35.1bn to price was just short of 2021's record-breaking Jan haul of EUR35.7bn.
Russia's invasion of Ukraine in February meant that conditions were far from ideal and resulted in the slowest February for the asset class since 2018.
February wasn't the only month to see lower volumes this year, with April (lowest since 2017), June (2016), July (2008), October (2018), December (2018) and even the usual frenetic month of September (2015) seeing long-term lows.
The latter came after some issuers decided to make the most of what was a favourable tone in August and break the usual summer slumber early. The monthly haul of EUR13.45bn ranked as the fourth largest August total on record behind 2018, 2019 and 2021.
Taking the accolade for the biggest volume month this year though was March (like it did in 2021), with the backlog caused by Russia's invasion of Ukraine unclogging as a host of borrowers tapped the single currency and made the most of what was a relatively solid backdrop and healthy investor appetite for paper.
March's total for the corporate asset class finished at EUR43.85bn, to rank it as the third biggest March on record for the sector, with only 2016 (EUR50.38bn) and 2020 (EUR49.1bn) seeing more paper.
That was propelled by the w/e 25-March where sixteen corporates printed a total of 34 separate tranches worth a combined EUR24.05bn to make it the third largest volume week for the asset class ever, having only been beaten by the w/e 15-May-2020 (EUR26.55bn) and w/e 3-Apr-2020 (EUR39.65bn).
With December being typically uneventful for the asset class, just one deal has crossed the tape in the form of ELO's EUR650m 6yr on the 1st of the month, resulting in the earliest close for euro corporate market since 2018.
2022 Supply by Month
NICs rise on the whole, demand remains strong
The aforementioned headwinds made for some less favourable conditions for issuers, with corporates forced to leave more on the table to ensure smooth execution.
Of those that did cross the tape in 2022, the average NIC paid jumped up. Having been under 10bps for the previous three years, this year the average rose to 13.72bps with investors demanding more to play ball and issuers having to pay up to reopen the market after bouts of volatility.
Not all managed to execute though though with four IG corporate names forced to postpone euro trades during execution due to “market conditions" this year compared to zero in 2021 and just two in 2020. There was also another postponement from Ceske Drahy although that was due to a high-speed train collision on the day, whilst GE Healthcare decided not to go ahead with a single currency offering having secured funding needed for its spin-off in the dollar market.
The larger carrot dangled by issuers this year did help drive investor interest on the whole though, as did the relative paucity of supply and higher absolute spreads and yields on offer.
Having seen the average cover ratio come in at 3.03x in 2021, the average rose to 3.25x in 2022 but was still well below 2020's eye-catching 4.39x average and also the 3.57x in 2019.
In other yearly review pieces due later in the week we will look at which deals saw the largest cover ratios and smallest NICs, whilst also delving deeper into which countries dominated supply and will also look in detail at ESG/hybrid activity.