The changing of the guard

Vince Lowry is CEO of Global Beta Advisors and discusses the impressive bull market that the US is still experiencing. Will this run continue or is it bad news for investors?
As we move along in year 11 of the country’s longest ever bull market, it’s fair to wonder when it will end.
A long, yet narrow bull market
Below is a list of all the 13 largest bull markets in the US, showing just how impressive the longevity of this bull market has been.
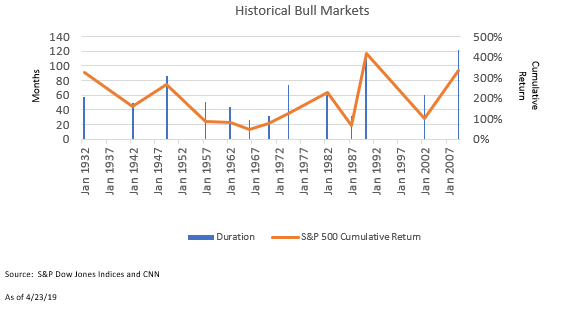
This particular bull market has been largely powered by a narrow segment of the market, specifically big tech names. The big tech names in this bull market has gained so much notoriety that they have adopted the acronym “FAANG” (Facebook, Amazon, Apple, Netflix, Google).
The S&P 500 index has gained an average annual return of 17.48% (Factset) in the span of this bull market, which is measured from the market bottom of 03/09/2009 through 09/30/2019. The “FAANG” names, which make up about 7% of the S&P 500 index, have contributed 7.25% of that return in that span (source: Factset).
In contrast to the tech bull market of the late 90s, we believe the catalyst for the narrowing of this bull market has been low global growth. The U.S. economy has largely offered the best prospects for economic growth relative to the rest of the global economy.
To that end, that has seemingly forced investors to bid up securities that are growing their revenues and earnings to astronomical multiples. We believe that, once global growth begins to normalize, these multiples on domestic growth stocks will come down, and in turn, underperform the rest of the market.
Have we seem this narrow tech part of a bull market before?
There was a similar narrow market during the dot com bubble. We define that period as January 1995 through December 1999. In that span, the S&P 500 index return an average annual return of 28.52% (Factset). The big tech names in that period were Microsoft, Intel, Cicsco, and IBM. They contributed about 10.83% of the S&P 500’s total return over that span.
In contrast with the long, slow recovery bull market; this bull market was driven by what appeared to be an overall expansion of information technology companies. As a result, tech stocks were achieving monumental revenue and earnings growth rates.
This led investors to believe that their growth was infinite, and in turn, bid those stocks to an extremely high premium relative to the rest of the market. However, in the first quarter of 2000, the euphoria was met with the harsh reality that a lot of that growth came from an influx of technology purchases in advance of Y2K.
Many thought the conversion into a new century would have debilitated the electronic infrastructure of the world. As a result, companies and individuals were buying software to equip them with the necessary tools against that. That coupled with the fears of a slowing economy created an environment for those securities to be ripe for the major selloff that ultimately occurred within that sector.
All hail the new leader: which should be who?
As history has shown, if a bull market is going to sustain, the market is going to need a new leader, given the frothy valuations that have been set forth in the market. For context of valuation, below are the current and historical price to sales ratios of the broad market S&P 500 compared with its growth and value counterparts:
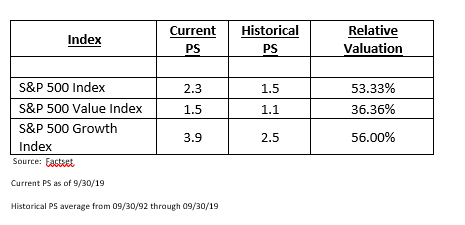
When you look at the above chart, you’re able to glean through historical perspective that “value” is far cheaper even on a historical basis than the broad market and growth sector of the market. This is important to understand because we believe that while valuation has generally shown to be a good indicator of long-term, future returns; relative valuation within an asset class is equally crucial.
Below charts out each the broad-based S&P 500, S&P 500 Value, and S&P 500 growth when its price to sales ratio is below a 50% premium to its historical average and when it exceeds a 50% premium relative to its historical average:
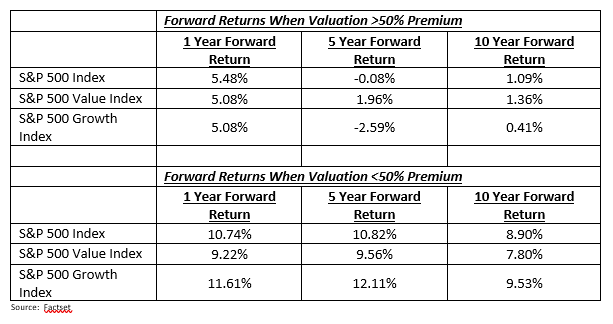
While this secular bull market has largely bucked the trend of the above chart, the evidence of this chart cannot be ignored, particularly as we are late cycle, according to many economists.
Vince Lowry will be speaking on dividends and incomes at Inside ETFs in Florida on Jan 28. Find out more about the biggest ETF even in the world.