Are There Different Kinds of Consumer Loyalty?

Are consumers fickle with their loyalty or are you not talking to the right loyal customers?
Loyalty can be a fickle thing. More so in today's world of the ultra-connected consumer. Who they are and how they engage with the world is shaped by an abundance of and growing number of interactions.
Our client, Company A, a global retailer with a presence in e-commerce as well as bricks & mortar, needed an updated and in-depth view of their consumers.
Along with an updated Brand Equity study, they also wanted to analyze consumer sentiment in regards to brands being more vocal about social issues.
In this particular case study, it became even more apparent that consumers should not be thought of, and marketed to, along simple segments or straightforward claims of something like loyalty.
Doing so leaves large gaps in understanding the whole story.
The problem Company A has, which many major retailers are now confronted with, is how to not only find, but engage effectively with their ideal consumers.
The world we currently live in, a world where brands are constantly competing for consumers’ attention, identifying what drives brand loyalty is imperative to understand.
There has been a rise of the Millennial and Gen Z consumer cohorts with growing purchasing power and vocal demands for brands to be aligned with their own values.
Many brands have been struggling with answering questions such as “what do or should we stand for?”
Are consumers more likely to be loyal to brands if the values of the company align with the consumers’ own values?
What are the consumer profiles of those who have strong opinions about a brand’s need to have a clear set of values that are communicated to their customers?
This has become ever more relevant in the context of brands taking a stand on social issues. Gillette, Nike, Patagonia anyone?
In a recent consumer study by Accenture, the survey results suggest many loyalty efforts are misdirected at things people don't want that much.
Only 34% of respondents said what makes them loyal today is completely the same as three years ago.
Some consumers would just as soon brands play hard to get, with 8% saying they have a negative reaction when companies try to earn their loyalty, with another 8% saying they're likely to be indifferent to such overtures.
How do you, and can you, really understand “loyal” customers?
Our client’s approach to these questions was the following:
- Brand Equity study with a focus on loyalty in the above context;
- Overall consumer sentiment related to brands taking a stand on social issues;
- The relationship between brand loyalty and consumer opinion on whether the brand should have clear values on issues that are potentially divisive;
- Lastly, consumer segmentation using behavioral and psychographic variables in relation to reported loyalty and personal beliefs.
Using the SightX end-to-end consumer research software, our client engaged with and analyzed all data from a nationally representative sample of 1,000 consumers across variables such as:
- Gender
- Income
- Age
- Ethnicity
- Family structure
Loyalty, Perceptions, and Values
In order to have better sight into brand loyalty and its drivers, these consumers were asked a number of questions, among them (below questions were on a 10-point scale):
- Their perception of loyalty to a particular brand
- Their perceptions on whether a brand should take a stand on social issues
- Sentiments associated with a particular brand they claim to be loyal to
- A measurement of personal values, each on a scale, including:
o Power: social power, authority, wealth
o Achievement: success, ambition, influence on people
o Hedonism: gratification, enjoyment, self-indulgence
o Stimulation: daring, varied, exciting, a challenging life
o Self-direction: creativity, freedom, curiosity
o Universalism: broad-mindedness, social justice, equality
o Benevolence: honesty, forgiveness, loyalty, responsibility
o Tradition: respect for tradition, humbleness, modesty
o Conformity: obedience, honoring elders, self-discipline
o Security: national & family security, social order, clean
The Approach & Findings
The client's insights team had traditionally conducted these types of studies. But they were getting overwhelmed with the increasing levels of analysis and speed that was required.
SightX offers the following competitive advantages:
- End-to-end platform: Users can set-up and design a project, target a specific audience, engage that audience and collect same day results, and then in real-time have advanced analysis and outputs at their fingertips;
- Speed: Projects from set-up to report generation can be done in one day;
- Depth: Automation of statistics for quantitative data, and Natural Language Processing (NLP) for text, SightX provides the ability for not only instant, but deep and sophisticated analyses
Some of the highlights for what they were able to immediately discern from this study were:
Overall, when the question “To what extent do you consider yourself loyal to a specific brand?” was asked, respondents answered with a mean of 6.85, and standard deviation of 2.55.
The follow up question was “In general, to what extent do you think brands should take a clear stand on social issues that may have the potential of being socially divisive?”, the overall average response was a mean of 6.22 and standard deviation of 2.84.
For measuring overall personal values, the average scores were the following:
| Mean | SD | |
| Power | 5.42 | 2.96 |
| Achievement | 6.97 | 2.68 |
| Hedonism | 6.12 | 2.90 |
| Stimulation | 6.41 | 2.64 |
| Self-direction | 7.74 | 2.21 |
| Universalism | 7.03 | 2.59 |
| Benevolence | 8.07 | 2.11 |
| Tradition | 7.35 | 2.41 |
| Conformity | 6.82 | 2.74 |
| Security | 7.73 | 2.31 |
While the average scores are slightly above the mean, when looking at the standard deviation for all of the variables it gives the signal that there is considerable variance in the way consumers actually scored.
In other words, it was tough to be certain which variables to focus on or use to guide decisions on how to design the message to consumers.
The natural next step was to determine which consumers scored relatively high and who are the ones who scored relatively low.
Consumer Segmentation
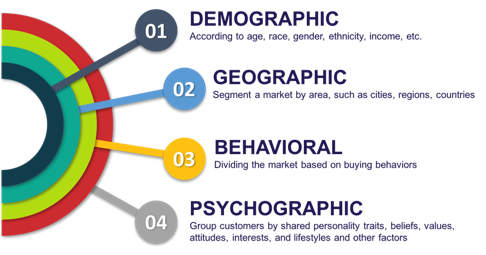
To follow up on the above findings, Company A was able to segment consumers in a variety of ways. There are four types of segmentations anyone can do:
- Demographic
- Geographic
- Behavioral
- Psychographic
They started the segmentation process by looking at any meaningful and statistical differences along demographic segmentations.
While a longer, in depth description of the math behind the process is better suited for another white paper, in short Company A just used a few filters within the SightX software and got results instantly.
They then conducted a series of t-tests and Analysis of Variance (ANOVAs) to explore potential significant differences in means (same comment re: how the analysis was done – real-time, click of a button).
To what extent do you consider yourself loyal to a specific brand?
When focusing on loyalty, the results indicated that there were no significant differences along gender or ethnicity.
When focusing on age, the only significant difference detected was between those who were born after 1996 and those born between 1965 and 1976, where the latter group scored significantly higher.
Younger generations, in general, are more likely to report being loyal to a brand.
What extent do you think brands should take a clear stand on social issues?
As for perceptions on whether or not brands should take a stand on social issues, the results indicated that there were no significant differences along gender.
When focusing on age, the only significant differences detected were between those born between 1977 and 1995 and those born between 1946 and 1964, where the latter group scored significantly lower.
Ethnicity revealed significant differences between African Americans/Black and White, where the latter group scored significantly lower.
Again, looking at age, we see a younger generation being more open to brands taking a stand on social issues.
In addition, along ethnicity lines, the younger male and female African American cohort specifically had stronger feelings that brands should take a stand on social issues.
As a next step, our client decided to deploy a type of machine learning available within SightX, called unsupervised learning. A type of machine learning that involves inferring the patterns within datasets without reference to known, or labeled, outcomes.
Unsupervised learning is used when no assumptions about the data set are made, meaning that the client did not want to look at consumers split along metrics like gender or ethnicity.
They were only interested in learning how any consumer responded to the variables they were asked about.
In this case, segmenting all consumers based only on their responses to reported loyalty and feelings about brands being vocal about social issues.
This type of segmentation, using a consumer’s personality traits, beliefs, values, etc. is a type of psychographic segmentation.
Next, they only needed to decide how many segments would be ideal for them across those two variables.
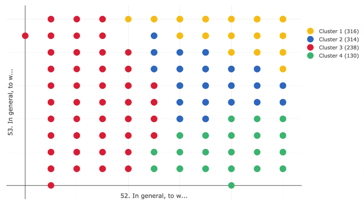
The results revealed 4 distinct types of Personas:
- Extremely loyal to a brand with very strong feelings about the need for brands to take a stand on social issues, even if socially divisive;
- Average measures across loyalty to brands and perceptions on whether the brand should take a stand;
- Low score in loyalty and below average score on the need for a brand to take a stand;
- Extremely loyal to a brand with strong feelings about the need for brands to NOT take a strong stand on social issues, even if socially divisive.
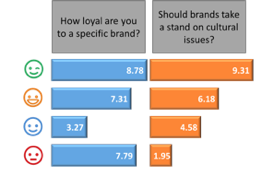
Persona A and Persona D were extremely interesting to explore. When Company A analyzed those individual profiles, the one strong differentiating factor was in the intensity or strength of their reported values.
Persona A scored significantly higher on all reported values than Persona D.
They really wanted to understand their loyal customer base. In doing so, they realized that this type of analysis, using machine learning to cluster segments of consumers across other variables took their understanding to the next level.
Learnings & Outcomes
The main takeaway for our client was an eye opening realization that “loyal” consumers are not a clean, cohesive bucket of customers they can message to and count on.
Loyalty is a complex matter.
While looking at average scores gives a general indication of population sentiments, true insights reside once you take a deeper dive into the data you already have. Easy enough when it’s just selected variables from a dropdown menu.
What Company A realized was that traditional statistics can be used to inform another class of analysis techniques.
All research and analysis should ideally complement each other.
It is easier now to be able to conduct an entire project from consumer engagement through analysis and reporting all in one place without sacrificing advanced and deep levels of analysis.
The follow-up work to this study was to evaluate the messaging of a variety of upcoming marketing campaigns. Perhaps a follow-up study to further understand various consumer segments.
In the end, having the confidence that business decisions are driven by sound analysis flows throughout the entire organization and makes everyone a hero.
- Once the project design was agreed upon, with a click of a button it was launched to a national consumer audience
- The project was completed in a few days and before week's end, the insights team was able to begin review of the analysis
- Insights and reports were able to be shared with the marketing and creative teams immediately
- Action was taken and the most effective messaging was tailor made for each segment, all with the confidence of data driven decisions


