
When evaluating private investments, it's easy to fall into the trap of relying on headline numbers and simple averages. However, experienced investors know that understanding the full return distribution and applying appropriate statistical analysis is essential for making sound investment decisions.
In a recent episode of the Adjusted for Risk podcast, Envestnet’s Dana D’Auria discussed the growing role of private markets in wealth management. Dana emphasized key risks including illiquidity, return dispersion, and valuation uncertainty. Below is a deep dive into the analytics that financial advisors should consider when incorporating private investments in their client’s investment portfolios.
The Problem with Simple Averages
Most of us are familiar with calculating arithmetic means, it's straightforward and provides a quick performance snapshot. However, in the context of private investments, this simplicity can be misleading. Private market investments, particularly venture capital, typically generate highly skewed returns, where a small number of exceptional performers drive the majority of gains while many investments deliver modest or negative results.
For example: a venture capital portfolio with ten investments where one returns 50x, two return 3x, and seven result in complete losses. The arithmetic mean might suggest attractive overall performance, but this single metric obscures a crucial reality, 70% of the portfolio failed entirely. For financial advisor’s making asset allocation decisions, this distinction matters significantly.
This is precisely why financial advisors should look beyond averages and traditional metrics to understand the complete performance picture.
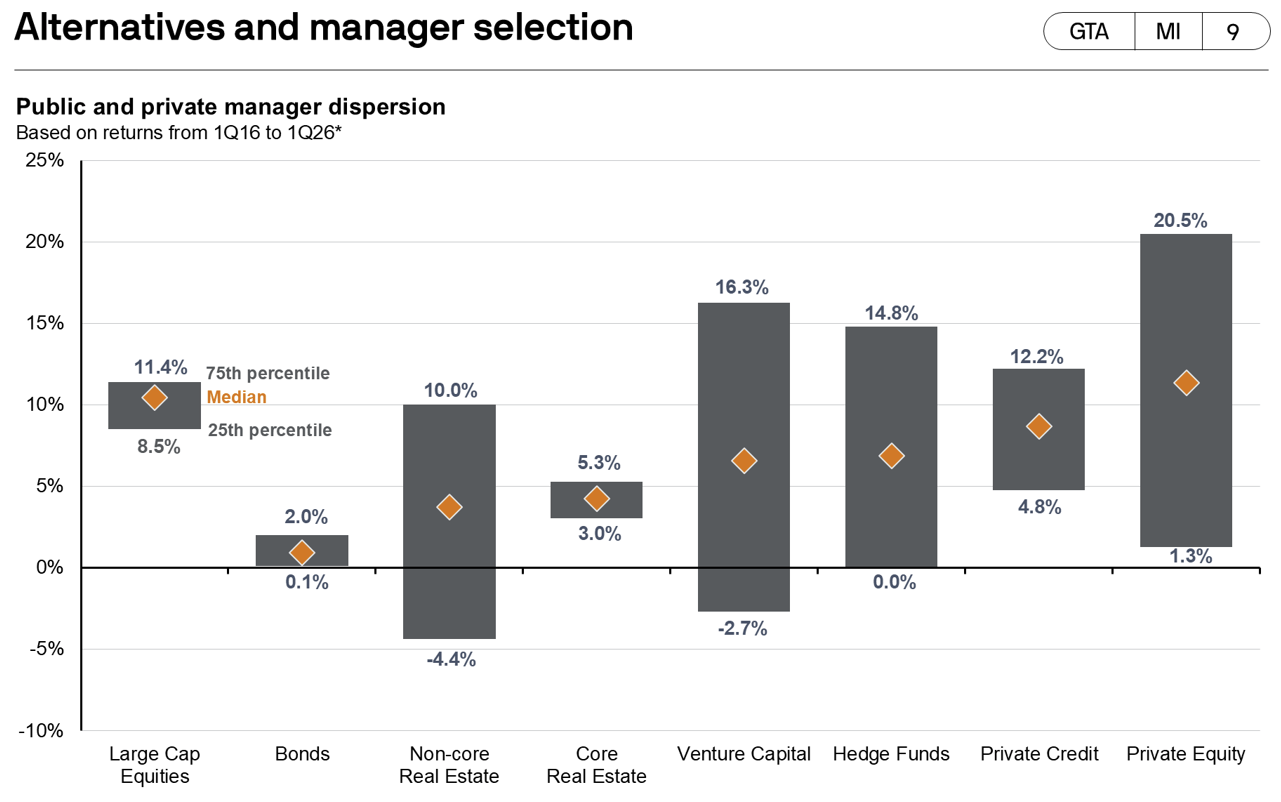 Figure 1: Source - J.P. Morgan Asset Management Guide to Alternatives, manager return dispersion over 10 years.
The Value of Understanding Return Distributions
Return distributions provide comprehensive insight into investment outcomes by revealing not just central tendency but also the range, shape, and probability of various results. Unlike many traditional asset classes, private investments rarely exhibit normal or symmetrical distributions. Instead, they typically display skewness, characterized by a long tail of exceptional performers and a concentration of mediocre or negative returns.
Understanding distribution shape enables investors to address fundamental questions: What's the probability of loss? How many investments need to succeed to achieve target returns? What level of concentration risk exists in the portfolio? These critical insights simply aren't available from average returns alone.
Venture capital provides a clear illustration. Returns typically follow a power law distribution, with performance highly concentrated among a few outliers. Research consistently demonstrates that the top 10% of venture investments can generate 90% or more of total returns. This distribution pattern has significant implications for portfolio construction, requiring adequate diversification to capture potential outliers while accepting that many investments will underperform.
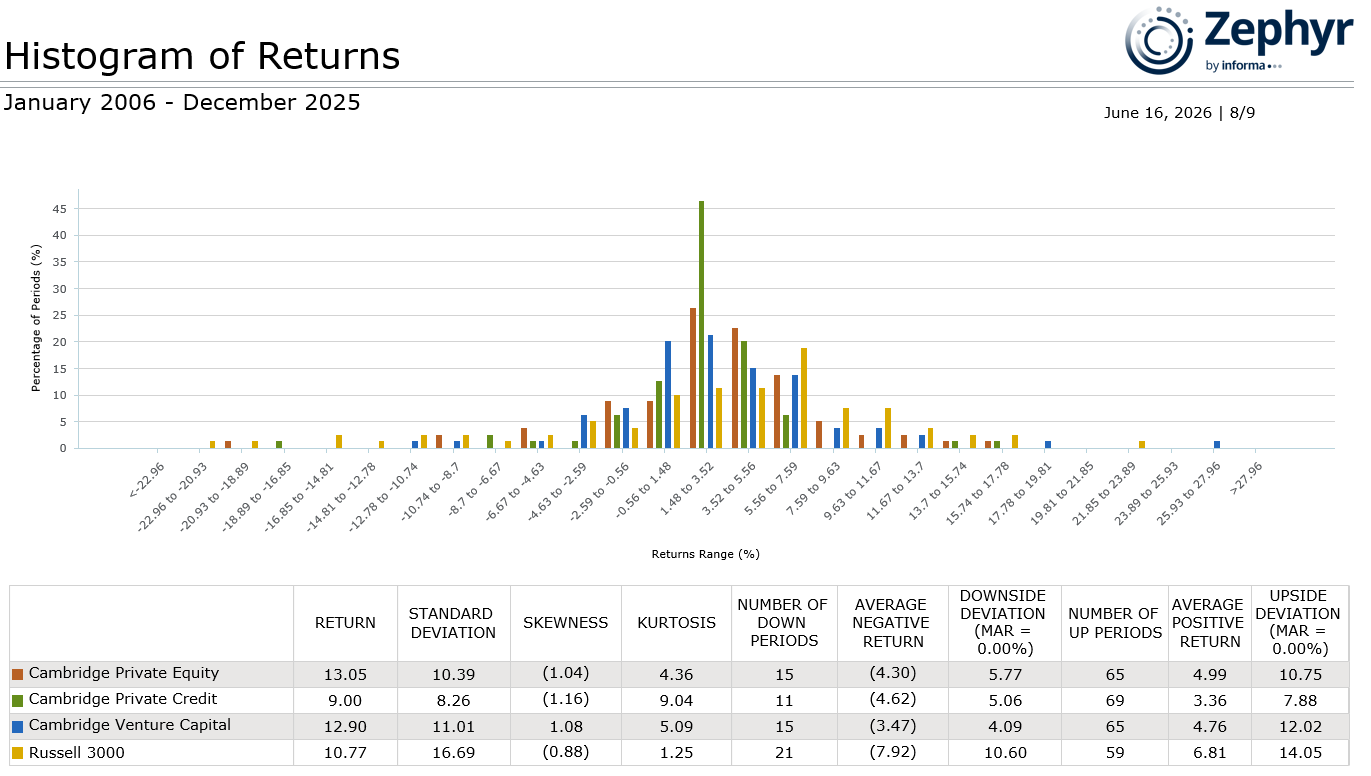 Figure 2: Source - Zephyr, quarterly returns
Essential Statistical Measures for Private Investment Analysis
To properly evaluate private investments, financial advisors should employ a comprehensive set of statistical measures that capture different dimensions of performance and risk.
Median Returns offer a more robust measure of central tendency than the mean, particularly for skewed distributions. The median represents the midpoint of returns, providing insight into typical investment outcomes without distortion from extreme values. In private equity, the gap between median and mean returns reveals the degree of skewness and the influence of outliers on overall performance.
Standard Deviation and Variance quantify the dispersion of returns around the mean, measuring volatility and uncertainty. While these metrics assume symmetrical distributions and may understate risk in positively skewed portfolios, they remain valuable for comparing relative volatility across strategies and time periods.
Quartile Analysis divides return distributions into four equal segments, revealing performance across the entire spectrum. Understanding first quartile (top 25%), median, and third quartile (bottom 25%) returns helps financial advisors set realistic expectations and evaluate manager selection effectiveness. In private equity, the substantial dispersion between quartiles underscores the critical importance of manager selection—top-quartile managers can significantly outperform their peers (Figure 1).
Skewness and Kurtosis provide deeper insights into distribution characteristics. Skewness measures asymmetry, positive skewness indicates a distribution with a long right tail of exceptional returns, while negative skewness suggests concentrated losses. Kurtosis measures the probability of extreme outcomes and identifies where the volatility risk came from in a distribution oof returns. High kurtosis signals a greater likelihood of both exceptional gains and significant losses (Figure 2).
Downside Risk Metrics focus specifically on negative outcomes, which are often most relevant for risk-conscious investors. Measures like the Zephyr Pain Index, downside deviation, maximum drawdown, and Value at Risk (VaR) quantify the magnitude and probability of losses, providing more relevant risk assessment than standard deviation for asymmetric return distributions.
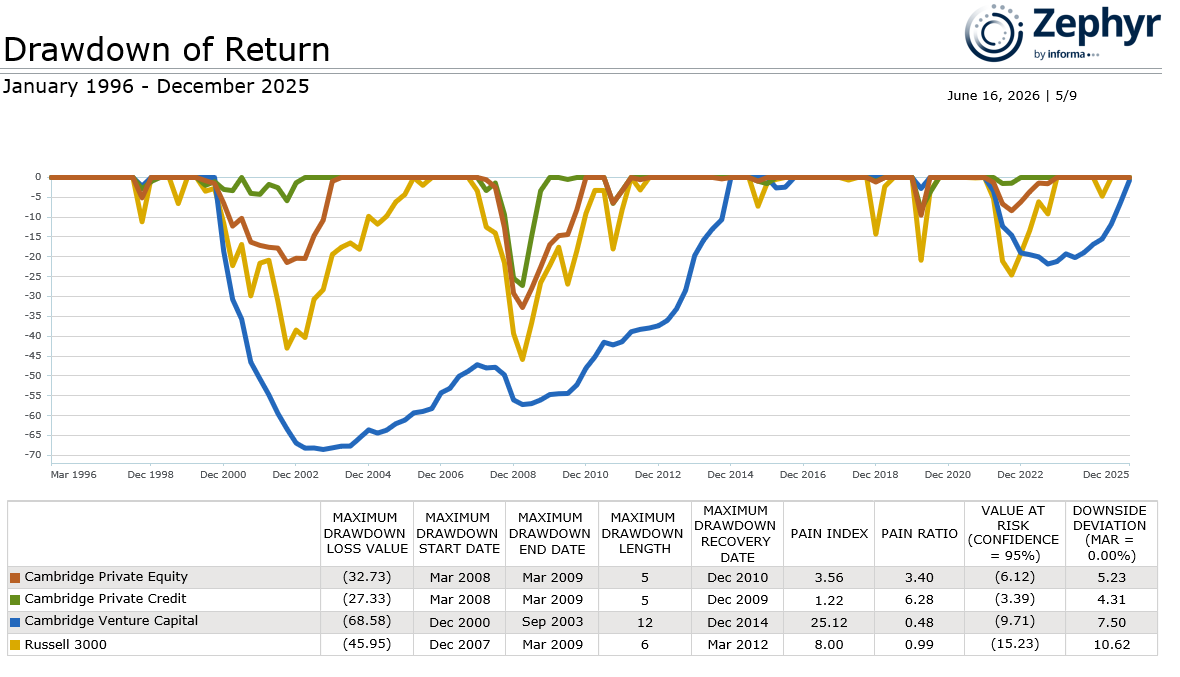 Figure 3: Source - Zephyr, quarterly returns
Understanding Power Law Dynamics
The power law distribution observed in venture capital and growth equity has important implications for investment strategy. Unlike normal distributions where extreme outcomes are rare, power law distributions make outliers not just possible but expected. This reality requires a fundamentally different approach to portfolio construction and performance evaluation.
Financial advisors operating under power law dynamics should maintain larger portfolios to ensure adequate exposure to potential outliers. They must also exercise patience, as identifying and capturing exceptional performers requires time for companies to mature and scale. Additionally, traditional risk management approaches focused on minimizing volatility may prove counterproductive, potentially screening out the high-risk, high-return opportunities that drive overall portfolio performance.
Time-Weighted vs. Money-Weighted Returns
Private investment analysis must account for the timing and magnitude of cash flows. Time-weighted returns (TWR) measure the compound growth rate of capital, isolating manager skill from the impact of capital flows. Money-weighted returns (MWR), or internal rate of return (IRR), account for the size and timing of contributions and distributions, reflecting the actual investor experience.
Both metrics serve distinct purposes. TWR enables fair comparison across managers and strategies by eliminating distortions from capital flow timing. MWR captures the reality of investor outcomes, including the impact of deployment pace and distribution timing. Financial advisors should consider both metrics alongside return distributions to develop a complete understanding of performance.
Practical Applications
Comprehensive statistical analysis enables better decision-making throughout the investment lifecycle. During due diligence, examining a manager's historical return distribution reveals consistency, risk management effectiveness, and the role of outliers in driving performance. Rather than focusing solely on average returns, financial advisors can assess the full range of outcomes and understand what drives results.
For portfolio construction, understanding correlation patterns and distribution shapes across strategies enables more effective diversification. Financial advisors can build portfolios that balance the pursuit of outlier returns with appropriate risk management.
Moving Forward with Better Analysis
The complexity of private investment returns demands analytical sophistication beyond simple averages. By embracing return distributions and appropriate statistical measures, financial advisors gain valuable insights into risk, opportunity, and the true nature of performance. This comprehensive approach supports more realistic expectations, improved manager selection, better portfolio construction, and ultimately, stronger long-term outcomes.
In an asset class where the performance gap between top-quartile and median managers can be substantial, the quality of analytical frameworks directly impacts investment success. Understanding return distributions isn't merely an academic exercise, it's a practical necessity for achieving excellence in private investments.