
One of the defining themes of the U.S. stock market over the past three years has been the phenomenon of high market concentration. Market concentration and the corresponding risks and opportunities have been the topic of many articles, research and conversations. As a financial advisor, understanding the implications of market concentration is critical to guiding clients through the complexities of investing in such environments.
This article explores the dynamics of highly concentrated stock markets and takes a look into the risks and opportunities they present, and strategies for managing portfolios effectively in these conditions.
Amplified Volatility and Systemic Risk
The belief that highly concentrated markets result in higher market volatility goes something like this:
Concentrated markets are inherently more volatile than well-distributed ones. When a small number of stocks drive market performance, any negative news affecting these companies creates outsized market movements. A disappointing earnings report, a regulatory investigation, or a shift in investor sentiment toward these dominant players can trigger sharp market declines that affect even investors who don't directly hold these securities.
This amplified volatility extends beyond individual portfolios to create systemic risk. When institutional investors, pension funds, and retail investors are all heavily exposed to the same concentrated positions, the potential for coordinated selling during market stress increases dramatically. This herd behavior can transform ordinary market corrections into full-blown crises, as everyone rushes for the exits simultaneously.
Historical Periods of High U.S. Stock Market Concentration and Subsequent S&P 500 Performance
Highly concentrated stock markets are not a new phenomenon. Based on historical data, the U.S. stock market has experienced several distinct periods of high concentration. While this phenomenon has become increasingly prevalent in recent years, particularly in major indices like the S&P 500, where technology giants have come to represent an outsized portion of total market value, it has occurred as far back as the Nifty Fifties. Concentration can be great for returns when market leaders are rallying. While concentration doesn’t guarantee a pull back is imminent, it mitigates diversification benefits and makes markets more vulnerable to shifts in investor sentiment. Here's a comprehensive analysis of these periods and the S&P 500's performance following period of high concentration during the Nifty Fifty Era, Dot Com Bubble and the current environment.
Major Concentration Periods in U.S. Market History
1. The Nifty Fifty Era (S&P 500 Peak Concentration: June 1965)
Concentration Details:
- The Nifty Fifty stocks (including IBM, Xerox, Polaroid, McDonald's, Disney, Pfizer, Coca-Cola, and others) dominated institutional portfolios
- Average P/E ratio of 42x for these stocks versus 19x for the broader S&P 500
- These "one-decision stocks" were considered safe, buy-and-hold investments
- Market concentration peaked at approximately 38% in 1965
Cumulative S&P 500 Performance Around Market Highs (January 1973):
- Between peek concentration (June 1965) and market high (January 1973): +67.72%
- 12 months following market high: -14.70%
- 24 months following market high: -37.30%
- 36 months following market high: -13.90%
The 10-year annualized return for the S&P 500 index following its highest level of concentration in 1965 was a meager +3.68%. While the S&P 500 index fell over 42% from its peak, the Nifty Fifty stocks performed even worse. Disney fell 85% from its peak while McDonalds and Xerox fell over 70%.
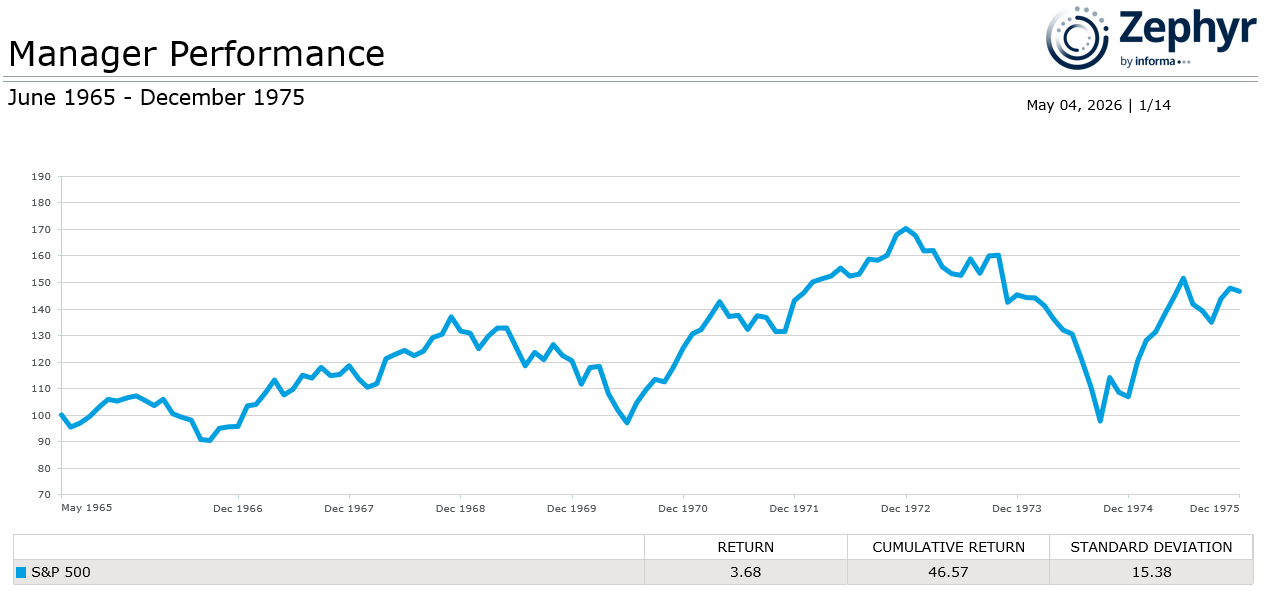 Figure 1: Source - Zephyr
2. Dot-Com Bubble (S&P 500 Peak Concentration: March 2000)
Concentration Details:
- Technology stocks reached 35% of S&P 500 market capitalization
- Top 10 stocks represented approximately 27% of the index at peak
- Companies like Cisco, Microsoft, Intel, Oracle dominated
- The Nasdaq Composite rose nearly 1,000% from January 1995 to March 2000 (Source: Koyfin)
- CAPE ratio reached a record (44), nearly triple its historical average (15).
Cumulative S&P 500 Performance Around Market Highs (August 2000):
- 12 months from peak: -14.33%
- 24 months following peak: -34.57%
- 36 months following peak: -27.61%
Longer-term impact:
- From August 2000 to July 2010, the S&P 500 index produced a cumulative total return of approximately -7.37%, famously known as the lost decade.
- The Nasdaq-100 index performed even worse with -46.44% cumulative return over the same decade.
- It took until October 2007 (86 months) for the S&P 500 to fully recover to its March 2000 peak
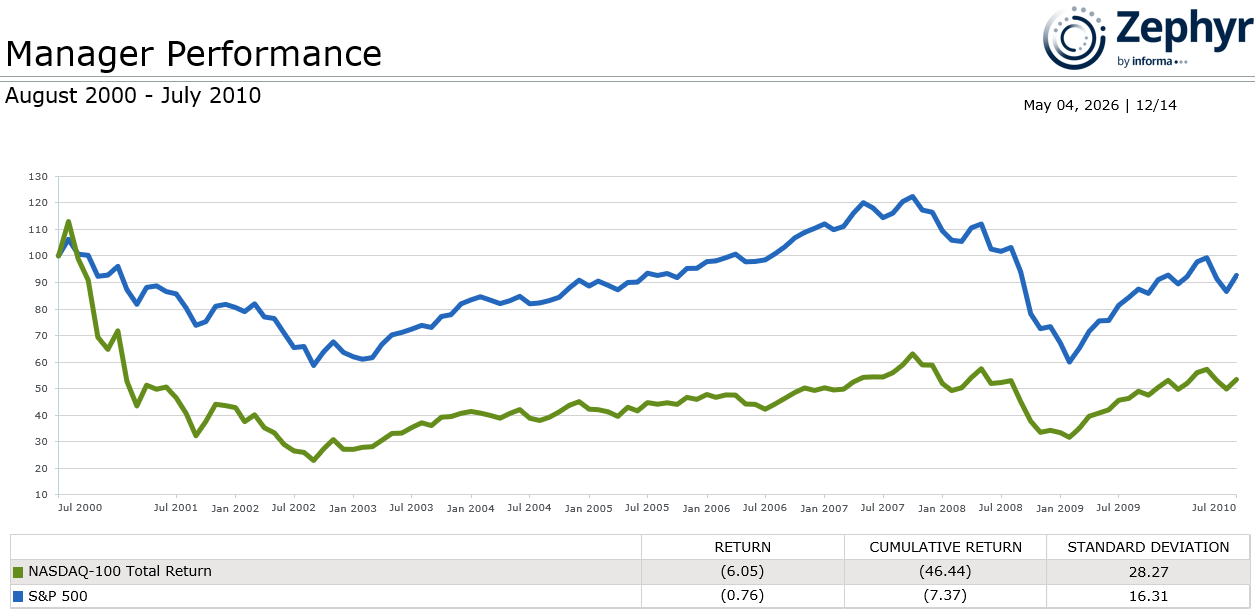 Figure 2: Source - Zephyr
3. Mega Tech/Magnificent 7 Era 2023-2026 (Peak Concentration: October 2025)
Concentration Details:
- During October 2025, the top 10 stocks represent approximately 40% of S&P 500 market cap (highest level in history.)
- This exceeds the Dot-Com peak of 27% and the Nifty Fifty Era of 38%.
- Top 10 stocks account for over 30% of total S&P 500 earnings.
- Dominated by technology and AI-related companies: Apple, Microsoft, Nvidia, Amazon, Alphabet, Meta, Tesla, Broadcom.
- After ten years of the top 10 stocks representing less than 20% of the S&P 500, the concentration spiked starting in 2020.
Cumulative S&P 500 and NASDAQ 100 Performance Around Market Highs (as of March 2026):
- From March 2020 – March 2026 the S&P 500 index produced a cumulative total return of 142% compared to 194% for the NASDAQ 100 index.
- From the peak concentration month of October 2025 through March 2026, the S&P 500 index fell a -1.79% compared to the NASDAQ 100 index falling a -3.49%
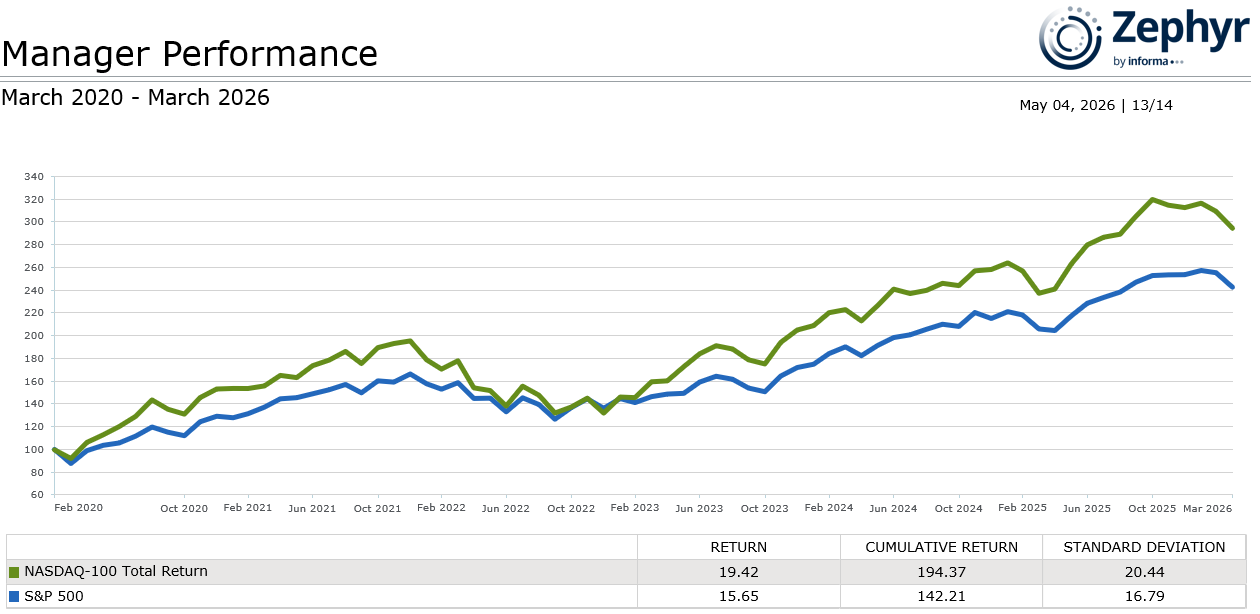 Figure 3: Source - Zephyr
Key Patterns and Insights
Common Characteristics of High Concentration Periods:
- Elevated Valuations: Concentrated stocks typically trade at significant premiums to the broader market
- Strong Recent Performance: Concentration builds after extended periods of outperformance
- Narrative-Driven: Each period features a compelling story (growth stocks, energy dominance, internet revolution, AI transformation)
- Institutional Herding: Professional investors pile into the same names
Strategies for Managing Concentration Risk
Recognizing concentration risk is the first step; managing it requires deliberate action. Investors should regularly analyze their portfolios to identify hidden concentrations, looking beyond surface-level diversification to understand true exposure. This analysis should consider not just individual holdings but also sector exposure, geographic concentration, and factor tilts.
Active rebalancing provides one tool for managing concentration risk. By systematically trimming positions that have grown to represent outsized portions of a portfolio, investors can maintain more balanced exposure.
Diversification across asset classes, investment styles, and geographic regions offers another layer of protection. While no portfolio can be completely immune to market downturns, true diversification can help cushion the impact of concentration-driven volatility.
Conclusion
Historical evidence demonstrates that periods of extreme market concentration have typically been followed by disappointing returns over the subsequent 12 months and beyond. While each period has unique characteristics, the pattern of mean reversion remains consistent. Financial advisors should recognize that high concentration introduces risks, even when the underlying companies are fundamentally strong. Diversification across market capitalizations, sectors, and investment styles has historically provided better risk-adjusted returns following periods of peak concentration.