The Role Alternatives Play in Asset Allocation
Diversification has come under the microscope during times of crisis like the Great Financial Crisis and the Pandemic lockdown. Portfolios that were traditionally considered diversified could not withstand the global reach of the crisis and protections failed when they were needed most. Furthermore, the baseline 60/40 portfolio has come under scrutiny due to the ending of the fixed income bull market which has also coincided with the steep equity market sell-off. The dual sell-off in both fixed income and equities has reinforced the notion that to increase portfolio diversification one should consider including alternative investments.
Diversification has come under the microscope during times of crisis like the Great Financial Crisis and the Pandemic lockdown. Portfolios that were traditionally considered diversified could not withstand the global reach of the crisis and protections failed when they were needed most. Furthermore, the baseline 60/40 portfolio has come under scrutiny due to the ending of the fixed income bull market which has also coincided with the steep equity market sell-off. The dual sell-off in both fixed income and equities has reinforced the notion that to increase portfolio diversification one should consider including alternative investments. Similar to what we have experienced over the past 2-years, correlations between equities and fixed income increase during times of crisis. It's no coincidence that during these times of increasing correlations the 60/40 portfolio (60% S&P 500 index/40% Bloomberg Barclays U.S. Aggregate index, rebalanced annually) returns falter, which is displayed in Figure 1.
With the popular 60/40 portfolio susceptible to a market crisis, one should consider the implications of taking a broader view of diversification in order to increase your portfolio’s ability to withstand market sell-offs. Below we take a deeper look at diversification and the different alternative investments available to retail investors to determine the impact they have on a portfolio and whether they are doing their intended job or not.
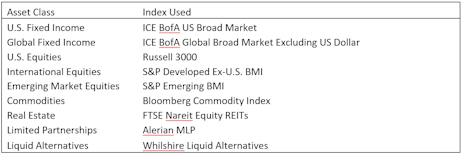
Before we get started it’s important to disclose the asset classes and corresponding indexes used to run the mean variance optimization analysis. Figure 1 displays the basic asset classes (U.S. equities and fixed income and foreign equities and fixed income), and the four alternative assets used – commodities, real estate investment trusts (REITs), master limited partnerships (MLPs), and liquid alternatives.
The process for constructing a risk/return optimized investment portfolio begins with creating a mix of investments with low correlations. Since investors are risk averse, it’s important to realize that correlations often fluctuate during a market cycle, and particularly increase during a crisis compared to long-term averages. In our first article regarding alternatives: “The Growing Space of Alternatives Provide Investors with Benefits”, we took a deeper look into the correlations between the above asset classes and how they change during different market regimes. The article highlights the benefits alternatives bring to portfolio construction, namely increased diversification during different market regimes.
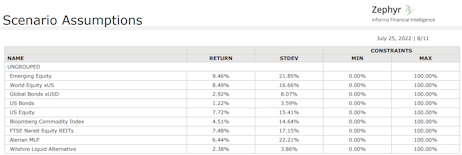
With the above knowledge in hand, we leverage Zephyr, an award winning investment management software application and move forward with constructing an efficient frontier to determine the impact alternatives have on a traditional asset allocation consisting of the core asset classes. To determine the forecasted returns for the core asset classes (U.S. and foreign equities and fixed income), we used the Black Litterman forecasting model, whereas for the alternative asset classes (commodities, real estate, limited partnerships, and liquid alternatives) we used the historical returns. Table 2 displays the forecasted returns and risks based on the time period between January 2000 – June 2022 that were used in this analysis.
As you can see in Figure 2, by adding the four alternatives listed above to an allocation case which includes the core asset classes, the efficient frontier shifts slightly to the northwest (orange line), which represents higher returns and lower risk. This is the intended result of adding alternatives to an allocation.
With all that being said, the difference between the two efficient frontiers is negligible. This is evidenced by comparing the two hypothetical portfolios listed in Figure 3. These two hypothetical portfolios, one composed only of the core assets (Optimal Core Asset Class) and one portfolio that includes alternatives (Optimal w/Alternatives), represent the most optimal portfolios along the two efficient frontiers. The most optimal portfolio, or the portfolio exhibiting the highest Sharpe Ratio, along the efficient frontier including only the core asset classes has a Sharpe Ratio of 0.4949. Conversely, the Optimal w/Alternatives portfolio has a Sharpe Ratio of 0.5041.
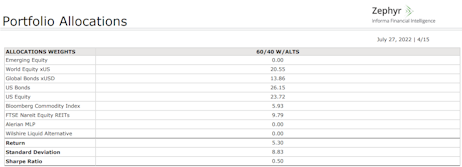
The next step is to create a 60/40 portfolio based on the efficient frontier that includes alternatives and compare it to the basic 60/40 portfolio we referenced at the onset of the article. Figure 4 shows the allocations for the newly created 60/40 portfolio including alternatives based on the efficient frontier created above.
In what may be surprising to some, the basic core 60/40 portfolio (60% S&P 500 index / 40% Bloomberg Barclays Aggregate index) performs very well against the newly created 60/40 portfolio including alternatives. As you can see in the following Zephyr portfolio analysis, the core 60/40 portfolio outperforms the 60/40 portfolio containing alternatives on an absolute return basis while also exhibiting lower standard deviation resulting in a higher Sharpe Ratio for the plain vanilla portfolio.
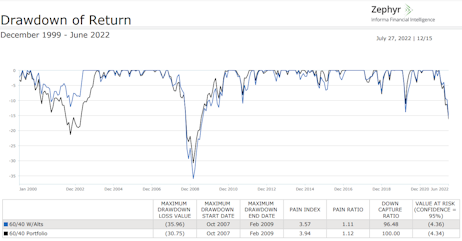
While the core 60/40 portfolio has a lower maximum drawdown (30.75 vs 35.96), the 60/40 portfolio with alternatives exhibits better comprehensive capital preservation tendencies with a pain index of 3.57 versus 3.94 for the core 60/40 portfolio.
Interestingly, I ran a similar analysis back in 2017 and the spread between similar efficient frontiers, one consisting of core asset classes and a second consisting of the same core and alternative asset classes, was much wider. Figure 11 shows the impact alternatives had on the efficient frontier as the shift to the northwest was much more pronounced than the current analysis. This is a good example of how time changes the inputs, particularly the forecasted returns and risk of the different asset classes. The forecasted returns for the current analysis are much tighter compared to the forecasted returns based off the time period between January 2000 and March 2017.
Despite not having a major impact on the efficient frontier, adding alternatives to a portfolio of core assets can add benefits to your portfolio. As this analysis shows, using different time periods can result in different outcomes, which shows the importance of formulating an investment strategy and sticking to it. When creating a portfolio for your client which aims to reduce unsystematic risk via diversification, alternative investments should be considered. Keep in mind that not all alternative investments are created equally, and that each alternative provides unique benefits to a portfolio. It’s important to look at all factors including what risk(s) you are trying to protect against as well as how correlations fluctuate during different market cycles.
Tags: Portfolio Analysis Software, Strategies for Wealth Management